. 2007 Jun 21;54(6):1001-10.
doi: 10.1016/j.neuron.2007.06.004.

Phase patterns of neuronal responses reliably discriminate speech in human auditory cortex

Affiliations

Phase patterns of neuronal responses reliably discriminate speech in human auditory cortex

Huan Luo et al. Neuron. .

Abstract

How natural speech is represented in the auditory cortex constitutes a major challenge for cognitive neuroscience. Although many single-unit and neuroimaging studies have yielded valuable insights about the processing of speech and matched complex sounds, the mechanisms underlying the analysis of speech dynamics in human auditory cortex remain largely unknown. Here, we show that the phase pattern of theta band (4-8 Hz) responses recorded from human auditory cortex with magnetoencephalography (MEG) reliably tracks and discriminates spoken sentences and that this discrimination ability is correlated with speech intelligibility. The findings suggest that an approximately 200 ms temporal window (period of theta oscillation) segments the incoming speech signal, resetting and sliding to track speech dynamics. This hypothesized mechanism for cortical speech analysis is based on the stimulus-induced modulation of inherent cortical rhythms and provides further evidence implicating the syllable as a computational primitive for the representation of spoken language.


Figures
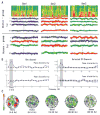
Figure 1
Figure 1
Spectrograms of sentence stimuli and representative MEG data for one subject. a, Example stimuli and single-trial responses (blue, red, green) from one channel. ‘Within-group’ bins (same color) constitute responses to the same condition, ‘across-group’ bins (mixed colors) to a random selection of trials across conditions. b, Left: ‘Phase dissimilarity function’ (upper) and ‘Power dissimilarity function’ (lower) as a function of frequency (0–50 Hz) for the same example channel. Grey box denotes the theta range (4–8 Hz) where the ‘phase dissimilarity function’ shows peaks above 0. Right: averaged dissimilarity functions across 20 selected channels showing maximum phase dissimilarity values in theta band for same subject (mean and standard error). c, ‘Phase dissimilarity distribution map’ for 5 frequency bands in same subject. Channels depicted with stronger red colors represent large phase dissimilarity values. The ‘theta phase dissimilarity distribution map’ shows the ‘dipolar’ distribution typical of auditory cortex responses.
Figure 2
Figure 2
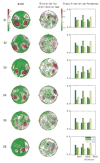
Auditory cortex identification, ‘theta phase dissimilarity distribution map,’ and classification performance for all subjects. Left: M100 contour map for each subject. Red indicates large absolute response value at M100 peak latency. Middle: Theta phase dissimilarity distribution map. Right column: Classification performance. The horizontal axis represents the stimulus condition (Sen1, Sen2, Sen3) and the bar color represents the category (Sen1, Sen2, Sen3) this stimulus was classified to. The height of the bar represents the proportion that one single-trial to this stimulus condition (horizontal axis) was classified to this stimulus category (bar color). Note that the sum of the three clustered bars is 1.
Figure 3
Figure 3
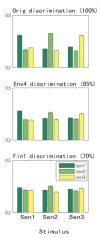
Classification performance as a function of intelligibility. Less intelligible stimuli show parametrically degrading classification. Top: Discrimination of 3 original sentences. Middle: Discrimination of three Env4 sentences. Bottom: Discrimination of three Fin1 sentences. The percent value in each figure indicates the intelligibility score from a previous experiment (Smith et al., 2002).
Figure 4
Figure 4
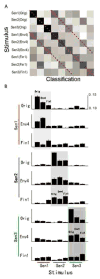
‘Theta phase pattern’ reflects category membership. a, Grand average of 9-condition classification matrix across 6 subjects. Each cell in the matrix represents the percent that a response trial for this stimulus condition (corresponding row) was classified to this stimulus category (corresponding column). The sum of each row is 1. Red lines indicate the main diagonal and sub-diagonals, where the response was classified to stimulus itself or members in the same category (different versions of same sentence). b, Classification histograms for each of the 9 stimulus conditions (3 sentences × 3 manipulated conditions). Rectangles indicate the range of corresponding correct category membership. For example, for all 3 versions of sentence 1 denoted by red vertical line (upper three rows), the rectangle covers the stimulus conditions all belonging to sentence 1, and should be classified into with higher percent than into other rectangles. Error bars indicate the standard error across 6 subjects.
Figure 5
Figure 5
Classification performance develops over time in each trial. Sample classification matrices as a function of integration time for 2 subjects. A six-condition (Original and Env4 versions of 3 sentences) classification analysis is shown. For example, 500-ms classification performance was calculated on only the first 500 ms of response, 1000-ms classification performance was calculated on the first 1000 ms of response, and so on. Unsurprisingly, because of the long period of theta (~200 ms), the MEG-recorded response must be collected over several periods before it becomes a robust discriminator. For Subject 2, robust discrimination ability emerged around 2000 ms, and for subject 4, the discrimination ability emerged around 3000 ms.
Figure 6
Figure 6
Performance of two control subjects. Upper panels: Contour map and classification performance of one control subject using 3 sentences without amplitude modulation. Lower panels: Contour map and classification performance of one subject using the same three sentences at a compression ratio of 0.5.

References

    1. Ahissar E, Nagarajan S, Ahissar M, Protopapas A, Mahncke H, Merzenich MM. Speech comprehension is correlated with temporal response patterns recorded from auditory cortex. Proceedings of the National Academy of Sciences of the United States of America. 2001;98:13367–13372. - PMC - PubMed
    1. Basar E. Brain function and oscillations. Springer; 1998.
    1. Boemio A, Fromm S, Braun A, Poeppel D. Hierarchical and asymmetric temporal sensitivity in human auditory cortices. Nature Neuroscience. 2005;8:389–395. - PubMed
    1. Dau T, Kollmeier B, Kohlrausch A. Modeling auditory processing of amplitude modulation. II. Spectral and temporal integration. J Acoust Soc Am. 1997;102:2906–2919. - PubMed
    1. Drullman R, Festen JM, Plomp R. Effect of temporal envelope smearing on speech reception. J Acoust Soc Am. 1994;95:1053–1064. - PubMed

Publication types

MeSH terms

LinkOut - more resources