. 2007 Aug 15;155(3):189-201.
doi: 10.1016/j.pscychresns.2007.03.002. Epub 2007 Jun 19.

Thalamo-cortical dysfunction in cocaine abusers: implications in attention and perception

Affiliations

Thalamo-cortical dysfunction in cocaine abusers: implications in attention and perception

Dardo Tomasi et al. Psychiatry Res. .

Abstract

Cocaine affects sensory perception and attention, but little is known about the neural substrates underlying these effects in the human brain. We used functional magnetic resonance imaging (fMRI) and a sustained visuospatial attention task to assess if the visual attention network is dysfunctional in cocaine abusers (n=14) compared to age-, gender-, and education-matched controls (n=14). Compared with controls, cocaine abusers showed (1) hypo-activation of the thalamus, which may reflect noradrenergic and/or dopaminergic deficits; (2) hyper-activation in occipital and prefrontal cortices, which may reflect increased visual cortical processing to compensate for inefficient visual thalamic processing; and (3) larger deactivation of parietal and frontal regions possibly to support the larger hemodynamic supply to the hyper-activated brain regions. These findings provide evidence of abnormalities in thalamo-cortical responses in cocaine abusers that are likely to contribute to the impairments in sensory processing and in attention. The development of therapies that diminish these thalamo-cortical deficits could improve the treatment of cocaine addiction.


Figures
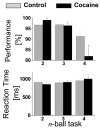
Fig 1
Fig 1
Average performance accuracy and reaction times during fMRI. Sample size: 14 cocaine abusers and 14 controls. Error bars are standard errors.
Fig 2
Fig 2
Statistical maps of the average BOLD signal across conditions (2-, 3-, and 4-ball tracking tasks) for 14 cocaine abusers (upper panel), 14 control subjects (middle panel), and for the differential activation between the groups (bottom panel). White labels (top) indicate the z-coordinate of each axial slice in mm in the Talairach frame of reference. White numbers and blue arrows indicate the BAs. Random-effects analyses (two-way repeated measures ANOVA). Red-yellow and blue-green color bars show the t-score windows for activation and deactivation, respectively.
Fig 3
Fig 3
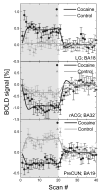
Average BOLD signals at specific ROIs (Table 1) during VA (2-, 3-, and 4-ball conditions combined) for 14 controls (gray) and 14 cocaine (black) subjects. (*) Differential effects between control and cocaine subjects were statistically significant (P < 0.05). ROI volume = 27 voxels (0.73 cc). Error bars are standard errors.
Fig 4
Fig 4
Average BOLD responses (symbols) across 14 controls (green) and 14 cocaine abusers (red) exemplifying the time courses of the fMRI signals in three ROIs (27 voxels; 0.73 cc; Table 1) and the fitted hemodynamic responses (lines) elicited by the VA task. Light-gray and white periods indicate task and rest blocks, respectively. Error bars are standard errors.
Fig 4
Fig 4
Average BOLD responses (symbols) across 14 controls (green) and 14 cocaine abusers (red) exemplifying the time courses of the fMRI signals in three ROIs (27 voxels; 0.73 cc; Table 1) and the fitted hemodynamic responses (lines) elicited by the VA task. Light-gray and white periods indicate task and rest blocks, respectively. Error bars are standard errors.
Fig 5
Fig 5
[Left] Statistical maps of VA-load activation for 14 control subjects (upper panel), 14 cocaine abusers (middle panel), and for the differential VA-load activation between the groups (load × group interaction effect on BOLD responses; bottom panel). Random-effects analyses (two-way repeated measures ANOVA). Red-yellow and blue-green color bars show the t-score windows for activation and deactivation, respectively. [Right] Scatter plots showing the load × group interaction effect on BOLD responses in left cerebellum (top) and the left FusG (bottom). Error bars are standard errors.
Fig 6
Fig 6
Linear correlations between differential (4 balls vs. 2 balls) accuracy and BOLD responses in the brain for cocaine abusers (full circles) and controls (open circles. Solid lines are linear fits, and r is the Pearson correlation coefficient. Error bars are standard errors.
Fig 6
Fig 6
Linear correlations between differential (4 balls vs. 2 balls) accuracy and BOLD responses in the brain for cocaine abusers (full circles) and controls (open circles. Solid lines are linear fits, and r is the Pearson correlation coefficient. Error bars are standard errors.

References

    1. Adler C, Sax K, Holland S, Schmithorst V, Rosenberg L, Strakowski S. Changes in neuronal activation with increasing attention demand in healthy volunteers: an fMRI study. Synapse. 2001;42:266–272. - PubMed
    1. Aharonovich E, Hasin D, Brooks A, Liu X, Bisaga A, Nunes E. Cognitive deficits predict low treatment retention in cocaine dependent patients. Drug and Alcohol Dependence. 2006;81:313–322. - PubMed
    1. Aharonovich E, Nunes E, Hasin D. Cognitive impairment, retention and abstinence among cocaine abusers in cognitive-behavioral treatment. Drug and Alcohol Dependence. 2003;71:207–211. - PMC - PubMed
    1. Arrington C, Carr T, Mayer A, Rao S. Neural mechanisms of visual attention: object-based selection of a region in space. Jounal of Cognitive Neuroscience. 2000;12(Suppl 2):106–117. - PubMed
    1. Ashburner J, Neelin P, Collins DL, Evans AC, Friston KJ. Incorporating prior knowledge into image registration. Neuroimage. 1997;6:344–352. - PubMed

Publication types