

Combining mouse mammary gland gene expression and comparative mapping for the identification of candidate genes for QTL of milk production traits in cattle
- PMID: 17584498
- PMCID: PMC1906769
- DOI: 10.1186/1471-2164-8-183
Combining mouse mammary gland gene expression and comparative mapping for the identification of candidate genes for QTL of milk production traits in cattle
Abstract
Background: Many studies have found segregating quantitative trait loci (QTL) for milk production traits in different dairy cattle populations. However, even for relatively large effects with a saturated marker map the confidence interval for QTL location by linkage analysis spans tens of map units, or hundreds of genes. Combining mapping and arraying has been suggested as an approach to identify candidate genes. Thus, gene expression analysis in the mammary gland of genes positioned in the confidence interval of the QTL can bridge the gap between fine mapping and quantitative trait nucleotide (QTN) determination.
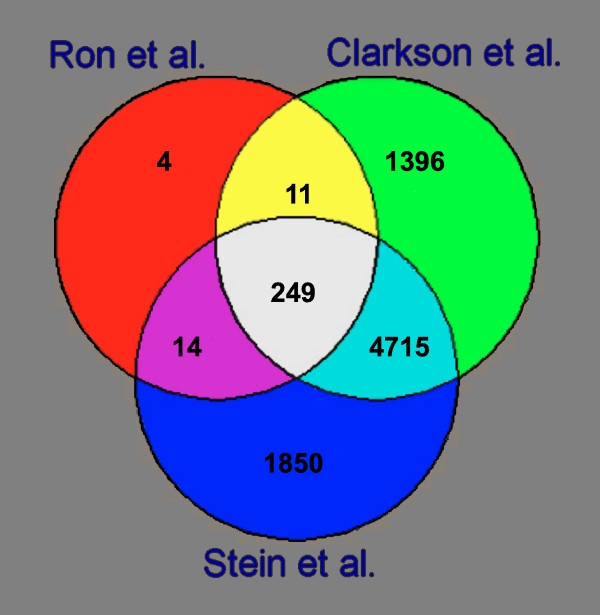
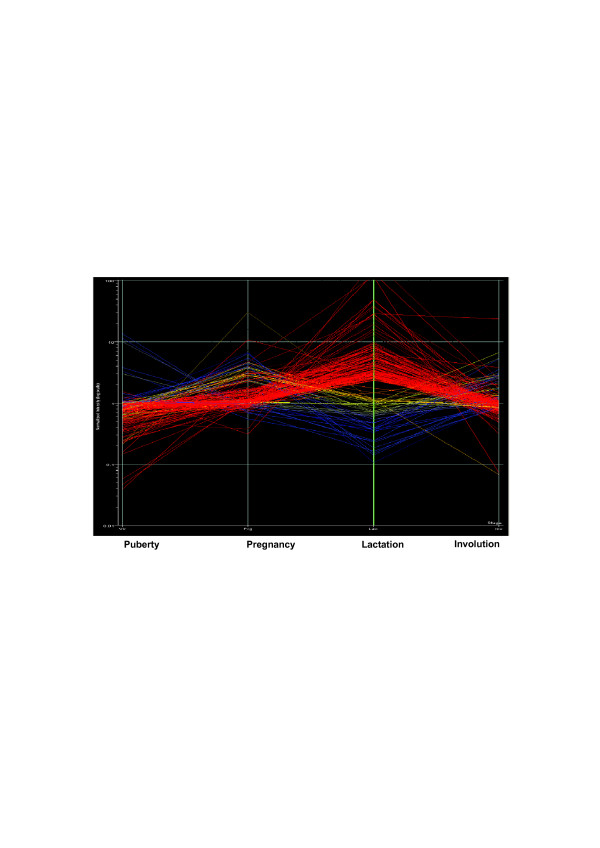
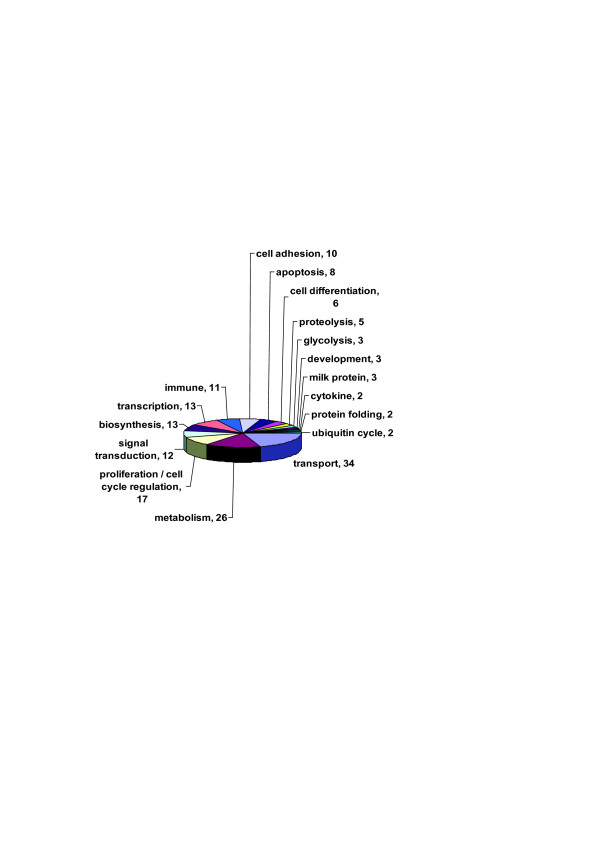
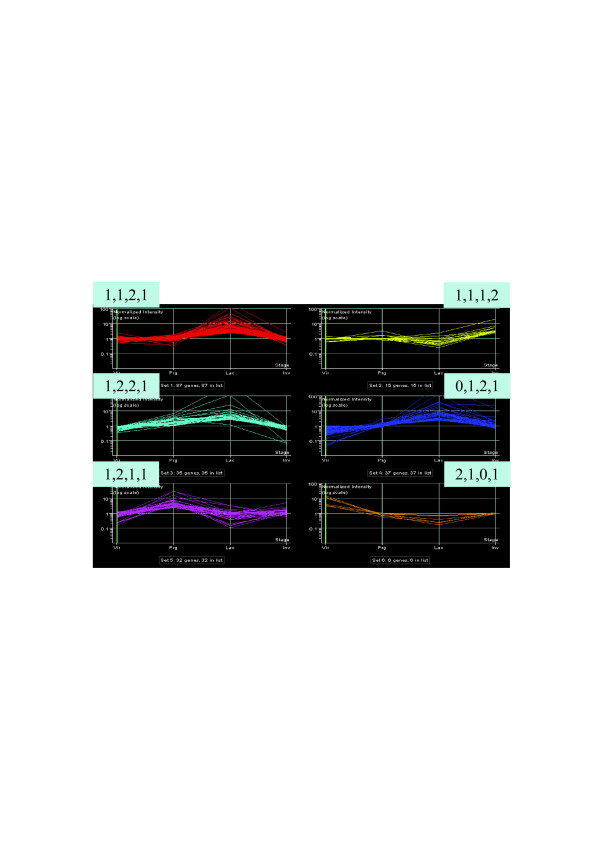
Results: We hybridized Affymetrix microarray (MG-U74v2), containing 12,488 murine probes, with RNA derived from mammary gland of virgin, pregnant, lactating and involuting C57BL/6J mice in a total of nine biological replicates. We combined microarray data from two additional studies that used the same design in mice with a total of 75 biological replicates. The same filtering and normalization was applied to each microarray data using GeneSpring software. Analysis of variance identified 249 differentially expressed probe sets common to the three experiments along the four developmental stages of puberty, pregnancy, lactation and involution. 212 genes were assigned to their bovine map positions through comparative mapping, and thus form a list of candidate genes for previously identified QTLs for milk production traits. A total of 82 of the genes showed mammary gland-specific expression with at least 3-fold expression over the median representing all tissues tested in GeneAtlas.
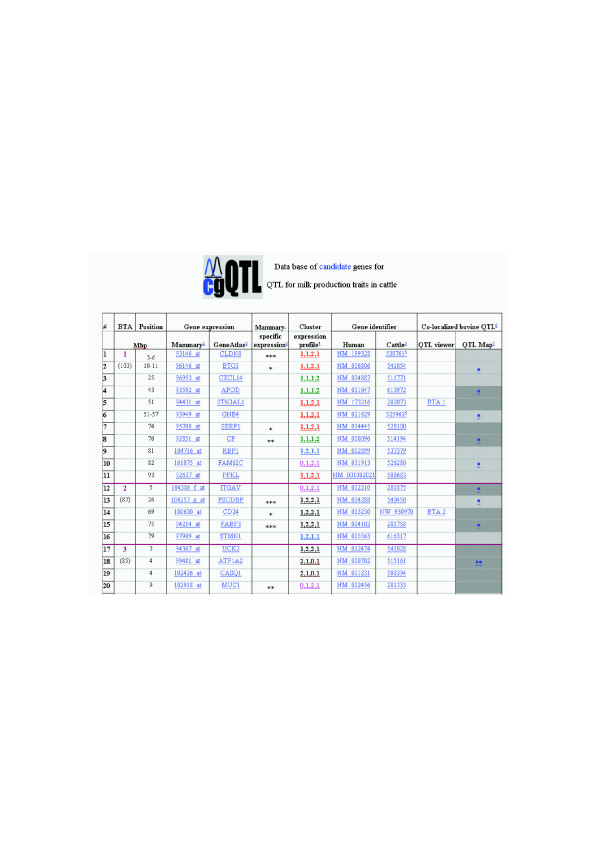
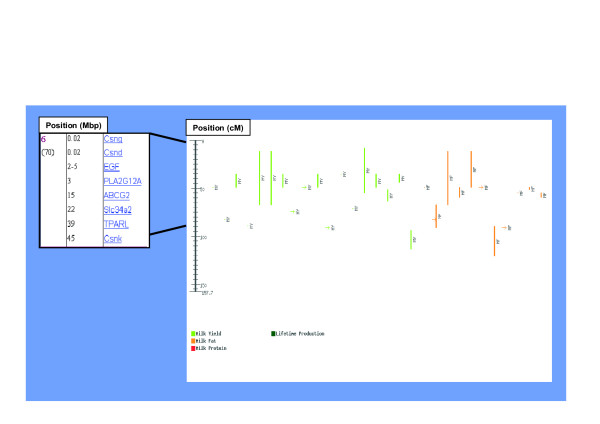
Conclusion: This work presents a web tool for candidate genes for QTL (cgQTL) that allows navigation between the map of bovine milk production QTL, potential candidate genes and their level of expression in mammary gland arrays and in GeneAtlas. Three out of four confirmed genes that affect QTL in livestock (ABCG2, DGAT1, GDF8, IGF2) were over expressed in the target organ. Thus, cgQTL can be used to determine priority of candidate genes for QTN analysis based on differential expression in the target organ.
Figures
Similar articles
-
Detection of quantitative trait loci influencing dairy traits using a model for longitudinal data.J Dairy Sci. 2002 Oct;85(10):2681-91. doi: 10.3168/jds.S0022-0302(02)74354-3. J Dairy Sci. 2002. PMID: 12416823
-
A gene-based high-resolution comparative radiation hybrid map as a framework for genome sequence assembly of a bovine chromosome 6 region associated with QTL for growth, body composition, and milk performance traits.BMC Genomics. 2006 Mar 16;7:53. doi: 10.1186/1471-2164-7-53. BMC Genomics. 2006. PMID: 16542434 Free PMC article.
-
From QTL to QTN identification in livestock--winning by points rather than knock-out: a review.Anim Genet. 2007 Oct;38(5):429-39. doi: 10.1111/j.1365-2052.2007.01640.x. Epub 2007 Aug 14. Anim Genet. 2007. PMID: 17697134 Review.
-
Fine mapping and association analysis of a quantitative trait locus for milk production traits on Bos taurus autosome 4.J Dairy Sci. 2009 Feb;92(2):758-64. doi: 10.3168/jds.2008-1395. J Dairy Sci. 2009. PMID: 19164688
-
Invited review: quantitative trait nucleotide determination in the era of genomic selection.J Dairy Sci. 2011 Mar;94(3):1082-90. doi: 10.3168/jds.2010-3793. J Dairy Sci. 2011. PMID: 21338774 Review.
Cited by
-
CCL8 Promotes Postpartum Breast Cancer by Recruiting M2 Macrophages.iScience. 2020 Jun 26;23(6):101217. doi: 10.1016/j.isci.2020.101217. Epub 2020 Jun 1. iScience. 2020. PMID: 32535027 Free PMC article.
-
Discovery of Gene Sources for Economic Traits in Hanwoo by Whole-genome Resequencing.Asian-Australas J Anim Sci. 2016 Sep;29(9):1353-62. doi: 10.5713/ajas.15.0760. Epub 2016 Mar 4. Asian-Australas J Anim Sci. 2016. PMID: 26954201 Free PMC article.
-
Genome-Wide Identification of Discriminative Genetic Variations in Beef and Dairy Cattle via an Information-Theoretic Approach.Genes (Basel). 2020 Jun 22;11(6):678. doi: 10.3390/genes11060678. Genes (Basel). 2020. PMID: 32580275 Free PMC article.
-
Whole-genome resequencing of two elite sires for the detection of haplotypes under selection in dairy cattle.Proc Natl Acad Sci U S A. 2012 May 15;109(20):7693-8. doi: 10.1073/pnas.1114546109. Epub 2012 Apr 23. Proc Natl Acad Sci U S A. 2012. PMID: 22529356 Free PMC article.
-
Candidate gene identification approach: progress and challenges.Int J Biol Sci. 2007 Oct 25;3(7):420-7. doi: 10.7150/ijbs.3.420. Int J Biol Sci. 2007. PMID: 17998950 Free PMC article. Review.
References
-
- Cattle QTL database http://www.animalgenome.org/QTLdb/cattle.html
-
- Ron M, Weller JI. From QTL to QTN identification in livestock – "Winning by points rather than knock-out". Animal genetics. 2007. a review. - PubMed
Publication types
MeSH terms
LinkOut - more resources
Full Text Sources
Molecular Biology Databases
Miscellaneous
