. 2007 Aug 15;583(Pt 1):175-93.
doi: 10.1113/jphysiol.2007.133231. Epub 2007 Jun 21.

Transient receptor potential TRPA1 channel desensitization in sensory neurons is agonist dependent and regulated by TRPV1-directed internalization

Affiliations

Transient receptor potential TRPA1 channel desensitization in sensory neurons is agonist dependent and regulated by TRPV1-directed internalization

Armen N Akopian et al. J Physiol. .

Abstract

The pharmacological desensitization of receptors is a fundamental mechanism for regulating the activity of neuronal systems. The TRPA1 channel plays a key role in the processing of noxious information and can undergo functional desensitization by unknown mechanisms. Here we show that TRPA1 is desensitized by homologous (mustard oil; a TRPA1 agonist) and heterologous (capsaicin; a TRPV1 agonist) agonists via Ca2+-independent and Ca2+-dependent pathways, respectively, in sensory neurons. The pharmacological desensitization of TRPA1 by capsaicin and mustard oil is not influenced by activation of protein phosphatase 2B. However, it is regulated by phosphatidylinositol-4,5-bisphosphate depletion after capsaicin, but not mustard oil, application. Using a biosensor, we establish that capsaicin, unlike mustard oil, consistently activates phospholipase C in sensory neurons. We next demonstrate that TRPA1 desensitization is regulated by TRPV1, and it appears that mustard oil-induced TRPA1 internalization is prevented by coexpression with TRPV1 in a heterologous expression system and in sensory neurons. In conclusion, we propose novel mechanisms whereby TRPA1 activity undergoes pharmacological desensitization through multiple cellular pathways that are agonist dependent and modulated by TRPV1.


Figures
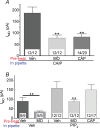
Figure 4
Figure 4
Roles of calcineurin and PIP2 biosynthesis pathways in pharmacological desensitization of TRPA1 by CAP and MO in sensory neurons Recordings were made of sensory neurons using whole-cell patch voltage clamp (Vh=−60 mV) configuration without ATP and GTP in the pipette solution. A, treatment of sensory neurons with the calcineurin inhibitor, CAIP, did not prevent TRPA1 desensitization by CAP and MO. CAIP (50 μm) was dialysed into cells via the recording pipette for 5 min. B, dialysis of sensory neurons for 15 min with natural PIP2 (100 μm) prevented desensitization of TRPA1 by CAP, but not by MO.
Figure 1
Figure 1
Cross-desensitization between TRPA1 and TRPV1 in sensory neurons Recordings were made of trigeminal ganglia (TG) sensory neurons using perforated patch configuration. A, the desensitization of IMO (50 μm; applied for 2 min) in TG neurons pre-treated with vehicle (0.01% DMSO supplied constantly with external solution), mustard oil (MO; 50 μm for 2 min) or capsaicin (CAP; 300 nm for 30 s). B, the desensitization of ICAP (300 nm applied for 30 s) in TG neurons pre-treated with vehicle, MO (50 μm) or CAP (300 nm). Drugs were applied at an interval of 3 min. The digits at the base of each bar refer to the number of cells exhibiting currents following the first challenge with drug (right part of digits; first drug is indicated on X-axis) and second application (left part of digits; second drug is indicated on Y-axis). Note: in ‘vehicle group’ both digits are the same number of responding cells, since there is no second drug application. Numbers of recorded/analysed cells will be represented this way in subsequent figures. C and D, representative traces are shown in the bottom panels from the IMO and ICAP desensitization experiments. Horizontal bars mark application of the noted drugs.
Figure 2
Figure 2
Cross-desensitization between TRPA1 and TRPV1 in CHO cells Recordings were made of TRPA1 and/or TRPV1-expressing CHO cells using perforated patch configuration. A, pharmacological desensitization of IMO (50 μm) induced by pre-treatment with CAP (0.3 μm) or MO (50 μm) was determined in transiently transfected CHO cells. B, pharmacological desensitization of ICAP (300 nm) evoked by application of CAP and MO in CHO cells. The Y-axis reflects current density (pA pF−1) for IMO (A) and ICAP (B), while the X-axis indicates drugs for pre-treatment and the types of channels expressed in the CHO cells. Drugs were applied at an interval of 3 min; CAP was applied for 30 s and MO was applied for 2 min. C and D, representative traces of IMO and ICAP recorded from TRPV1- (C) and TRPA1- (D) expressing CHO cells. E and F, representative traces of CAP-induced IMO (E) and MO-induced ICAP (F) desensitization in TRPA1/TRPV1-coexpressing CHO cells. Horizontal bars mark application of the drugs.
Figure 3
Figure 3
Effect of extracellular Ca2+ on the desensitization of TRPA1 by MO and CAP in sensory neurons Recordings were made of sensory neurons using perforated patch configuration. A, summary data for IMO desensitization by CAP and MO in Ca2+-free extracellular solution. CAP (300 nm; for 30 s) or MO (50 μm; for 2 min) was applied at an interval of 3–8 min. IMO and ICAP have slow decay times after drug removal. Therefore, if currents did not decline to baseline within 3 min of beginning the treatment, then the second application was delayed for 2–5 min (see C and D). B, separate presentation of IMO tachyphylaxis in Ca2+-free extracellular solution for two types of neurons. In the first group (n = 8), IMO tachyphylaxis is not registered, while in the second group (n = 10), tachyphylaxis is observed. C and D, representative traces illustrate IMO tachyphylaxis for neurons belonging to the first (C) and second (D) groups. E, trace shows lack of IMO desensitization by CAP in Ca2+-free conditions. Horizontal bars mark application of the drugs.
Figure 5
Figure 5
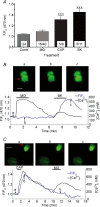
CAP, but not MO, activates phospholipase C (PLC) and hydrolyses PIP2 in sensory neurons A, CAP (300 nm) and bradykinin (BK; 100 nm), but not MO (50 μm), treatments of sensory neurons expressing GFP-tagged PLCδ-PHD caused translocation of the GFP-PLCδ-PHD from the plasma membrane region into the cytosol. Fluorescence emission (at 470 nm) was measured in the cytoplasmic area of neurons. The Y-axis represents normalized data (F/F0) against baseline emission density of the same area (F0). The digits inside the bars indicate the number of responsive neurons (left side) and the total number of analysed neurons (right side). The negative control in this experiment was the measurement of GFP-tagged PLCδ-PHD translocation in MO non-responsive cells (defined by MO application producing no accumulation in [Ca2+]i). B and C, representative simultaneous real-time fluorescence imaging traces of [Ca2+]i accumulation (black line) and GFP-PLCδ-PHD translocation (blue line) after treatment of neurons with MO followed by BK (B) or CAP followed by MO (C). Data were collected every 10 s with alternating exposure for 200 ms at 340 nm, for 200 ms at 380 nm and for 300 ms at 470 nm. Horizontal bars mark the duration of indicated drug applications. Fluorescence images highlight distribution of GFP-PLCδ-PHD in neurons at time points a, b or c. GFP-PLCδ-PHD is mainly distributed on the plasma membrane at the time points a and b, while at the time point c, GFP-PLCδ-PHD translocates from the plasma membrane to the cytosol, leading to an increase in fluorescence density in the cytosolic area (measurement area) of the cells and a reduction in fluorescence on the rim of the cell. Note that this effect is detected in the lower, but not the upper neuron. Baseline readings were collected for 1 min, after which CAP or MO was applied for 40 s or 2 min, respectively. The neurons were washed for 4 min and BK (as a positive control) or MO (to demonstrate CAP-evoked desensitization of TRPA1) was reapplied for 2 min each. Both experimental protocols demonstrated MO-unresponsive neurons. Responsive cells are marked by red arrows. White scale bars represent 20 μm.
Figure 6
Figure 6
CAP hydrolyses PIP2 in TRPA1/TRPV1-expressing CHO cells, and MO hydrolyses PIP2 in both TRPA1 and TRPA1/TRPV1-expressing CHO cells A, effect of CAP (300 nm) and MO (50 μm) treatments of CHO cells expressing either TRPA1/GFP-PLCδ-PHD or TRPA1/TRPV1/GFP-PLCδ-PHD on the translocation of PLCδ-PHD. CHO cells expressing GFP-PLCδ-PHD alone were considered as negative controls. The types of treatment and expression patterns of CHO cells are noted below the X-axis. B and C, representative fluorescence imaging traces of TRPA1/TRPV1/GFP-PLCδ-PHD-expressing CHO cells treated twice with MO (B) or with CAP followed by MO (C). Experiments were performed as described in the legend for Fig. 5. Responsive cells are marked by red arrows. White scale bars represent 7 μm.
Figure 7
Figure 7
TRPV1 regulates pharmacological desensitization of TRPA1 by MO Recordings were made of wild-type and TRPV1 KO mouse sensory neurons using perforated patch configuration. A, IMO tachyphylaxis was measured in WT and TRPV1 KO mice. Standard (2 mm Ca2+) and Ca2+-free (0 mm Ca2+) extracellular solutions were used to examine IMO (50 μm) tachyphylaxis. Significant differences between values of various groups are marked over horizontal bars connecting the bars which represent those groups. Treatments, mouse lines and the amount of Ca2+ in the extracellular solution are indicated below the X-axis. Note that the blue horizontal bar refers to statistically significant difference between IMO in the WT versus TRPV1 KO on the second application of MO. The red horizontal bar indicates significant increase in IMO recorded in Ca2+-free solution (0 Ca-ES) versus in standard extracellular solution (SES). B, separate presentation of IMO tachyphylaxis in Ca2+-free extracellular solution for two types of neurons. This putative division into group of neurons can be made for both WT and TRPV1 KO mouse neurons. C, representative traces demonstrate IMO tachyphylaxis in neurons from WT and TRPV1 KO mice. D, two different traces illustrate IMO tachyphylaxis in Ca2+-free media for the first (upper panel) and second (bottom panel) groups of neurons isolated from TRPV1 KO mice.
Figure 9
Figure 9
TRPV1 controls MO-evoked TRPA1 internalization in sensory neurons Trigeminal sensory neurons isolated from rat (A–C), wild-type and TRPV1 KO mouse (D and E) were treated for 20 min with MO (50 μm; treatment is noted below blots). After treatment, cell lysate (‘CL’) and streptavidin-precipitated (‘Strept’) biotinylated cell surface proteins were isolated and immunoblotted with appropriate antibodies noted above blots. Membranes illustrated in A were stripped and re-probed with β-actin (C) to demonstrate that biotinylation was restricted to surface proteins. Cell lysate and TRPV1 (for A and D only) served as an internal normalization control in these experiments. Molecular weight markers are shown on left side of each blot. Bands corresponding to TRPA1, TRPV1 and β-actin are marked with arrows on right sides of the blots.
Figure 8
Figure 8
TRPV1 controls MO-evoked TRPA1 internalization in transfected CHO cells CHO cells were transfected with no cDNA (i.e. mock transfection), TRPA1 (A and C), TRPV1 (B) or TRPA1/TRPV1 (D and E). Transfection constructs (M, mock; V, TRPV1; A, TRPA1; A/V, TRPA1/TRPV1) are indicated as ‘cDNA’ below blots. Cells were treated for 20 min with MO (50 μm; treatment is noted below blots). After treatment, cell lysate (‘Cell Lysate’) and streptavidin-precipitated (‘Streptavidin’) biotinylated cell surface proteins from separately transfected TRPA1- (A and C) and TRPV1- (B) expressing CHO cells or cotransfected TRPA1/TRPV1-expressing CHO cells (D and E) were isolated and immunoblotted with appropriate antibodies noted above blots. Membranes illustrated in A were stripped and re-probed for β-actin (C) as a negative control for surface biotinylation of proteins. Cell lysate and TRPV1 (for D and E only) served as an internal normalization control in these experiments. Molecular weight markers are shown on left side of each blot. Bands corresponding to TRPA1, TRPV1 and β-actin are marked by arrows on right sides of the blots.

References

    1. Abe J, Hosokawa H, Sawada Y, Matsumura K, Kobayashi S. Ca2+-dependent PKC activation mediates menthol-induced desensitization of transient receptor potential M8. Neurosci Lett. 2006;397:140–144. - PubMed
    1. Bandell M, Story GM, Hwang SW, Viswanath V, Eid SR, Petrus MJ, Earley TJ, Patapoutian A. Noxious cold ion channel TRPA1 is activated by pungent compounds and bradykinin. Neuron. 2004;41:849–857. - PubMed
    1. Bautista DM, Jordt SE, Nikai T, Tsuruda PR, Read AJ, Poblete J, Yamoah EN, Basbaum AI, Julius D. TRPA1 mediates the inflammatory actions of environmental irritants and proalgesic agents. Cell. 2006;124:1269–1282. - PubMed
    1. Bernstein GM, Jones OT. Kinetics of internalization and degradation of N-type voltage-gated calcium channels: Role of the α2/δ subunit. Cell Calcium. 2006;41:27–40. - PubMed
    1. Bhave G, Zhu W, Wang H, Brasier DJ, Oxford GS, Gereau RWT. cAMP-dependent protein kinase regulates desensitization of the capsaicin receptor (VR1) by direct phosphorylation. Neuron. 2002;35:721–731. - PubMed

Publication types

MeSH terms

LinkOut - more resources