Comparative Study
. 2007 Aug 15;583(Pt 1):365-80.
doi: 10.1113/jphysiol.2007.128827. Epub 2007 Jun 21.

Myofibre damage in human skeletal muscle: effects of electrical stimulation versus voluntary contraction

Affiliations
Comparative Study

Myofibre damage in human skeletal muscle: effects of electrical stimulation versus voluntary contraction

R M Crameri et al. J Physiol. .

Abstract

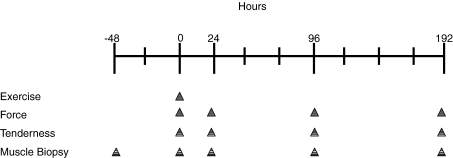
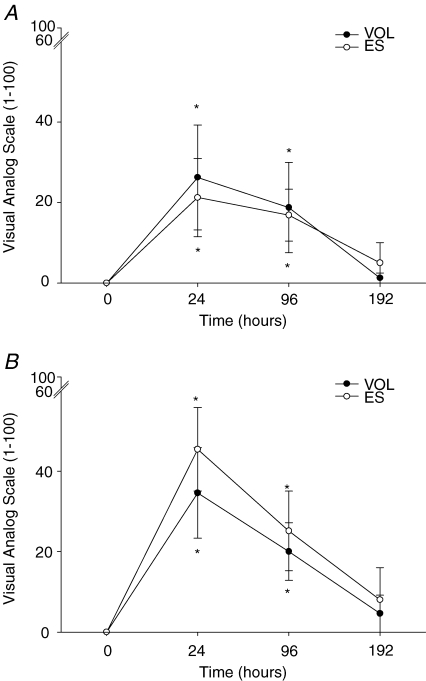
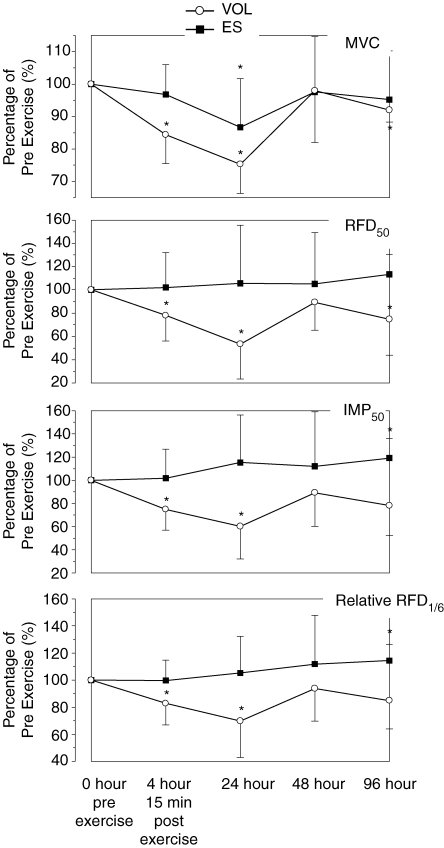
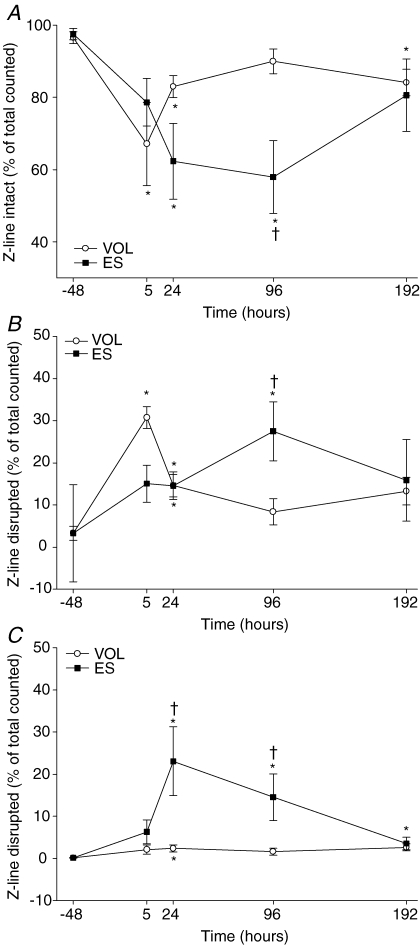
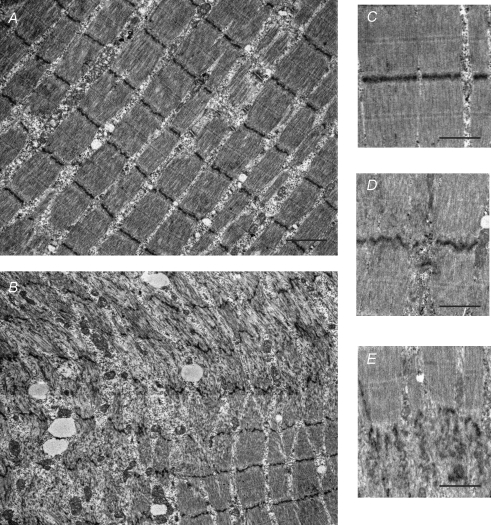
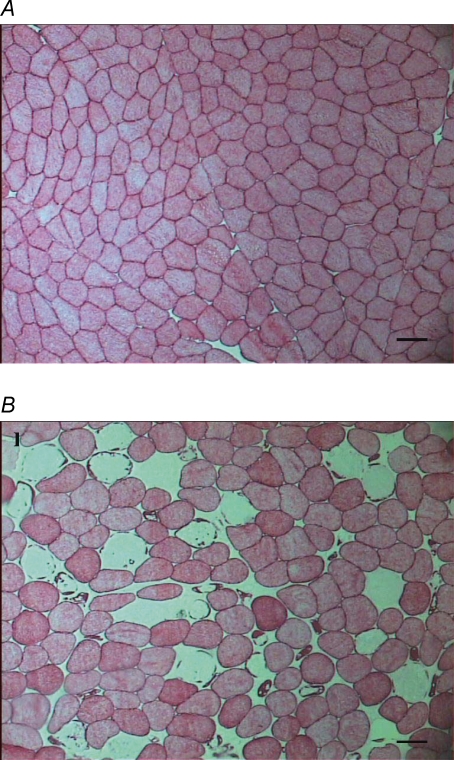
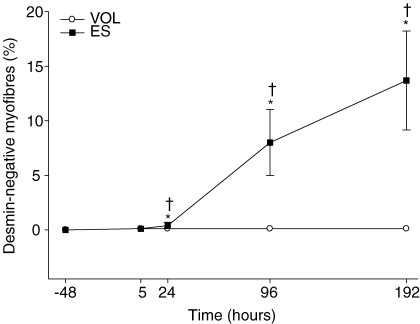
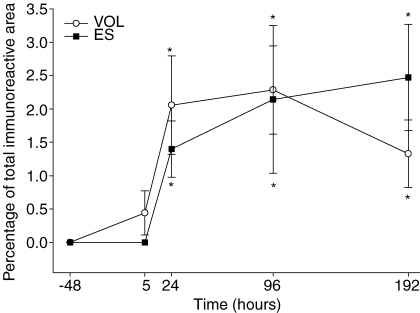
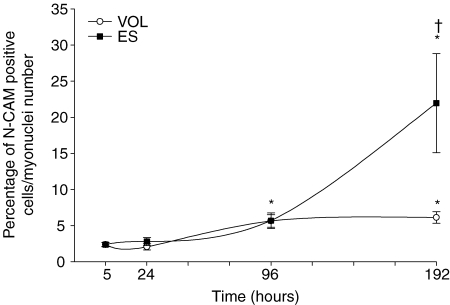
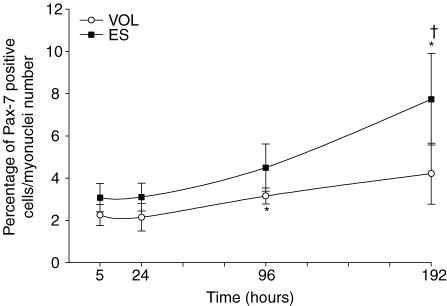
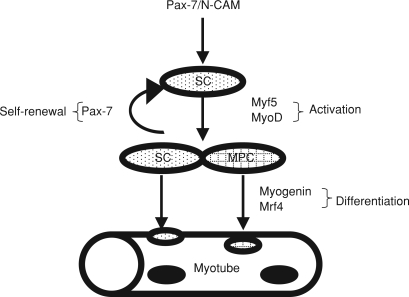
Disruption to proteins within the myofibre after a single bout of unaccustomed eccentric exercise is hypothesized to induce delayed onset of muscle soreness and to be associated with an activation of satellite cells. This has been shown in animal models using electrical stimulation but not in humans using voluntary exercise. Untrained males (n=8, range 22-27 years) performed 210 maximal eccentric contractions with each leg on an isokinetic dynamometer, voluntarily (VOL) with one leg and electrically induced (ES) with the other leg. Assessments from the skeletal muscle were obtained prior to exercise and at 5, 24, 96 and 192 h postexercise. Muscle tenderness rose in VOL and ES after 24 h, and did not differ between groups. Maximal isometric contraction strength, rate of force development and impulse declined in the VOL leg from 4 h after exercise, but not in ES (except at 24 h). In contrast, a significant disruption of cytoskeletal proteins (desmin) and a rise of myogenic growth factors (myogenin) occurred only in ES. Intracellular disruption and destroyed Z-lines were markedly more pronounced in ES (40%) compared with VOL (10%). Likewise, the increase in satellite cell markers [neural cell adhesion molecule (N-CAM) and paired-box transcription factor (Pax-7)] was more pronounced in ES versus VOL. Finally, staining of the intramuscular connective tissue (tenascin C) was increased equally in ES and VOL after exercise. The present study demonstrates that in human muscle, the delayed onset of muscle soreness was not significantly different between the two treatments despite marked differences in intramuscular histological markers, in particular myofibre proteins and satellite cell markers. An increase in tenascin C expression in the midbelly of the skeletal muscle in both legs provides further evidence of a potential role for the extracellular matrix in the phenomenon of delayed onset of muscle soreness.


Figures

Figure 1
Figure 1
Time line of the protocol followed
Figure 2
Figure 2
Muscle tenderness assessed by pressure probe placed over the vastus lateralis muscle (A) or during a maximal voluntary contraction (B) No significant difference was found between the two treatments; however, a significant time effect was noted (P < 0.05). *P < 0.05 different from pre-exercise.
Figure 3
Figure 3
Recordings of representative eccentric loading trials Knee joint angular velocity (KC velocity), quadriceps extensor moment of force (moment of force) and knee joint angle (KC position) during maximal voluntary eccentric contractions at slow contraction speeds (A) and when electrostimulation was applied to the vastus lateralis muscle (B). Continuous line traces represent the range of motion that fulfilled the criterion of true constant angular velocity. Note the differences in force scale between voluntary and stimulated trials. Power is not shown because these curves were identical in shape to the moment curves owing to the isokinetic contraction task (constancy in joint angular speed).
Figure 4
Figure 4
Relative changes in MVC and in rapid muscle strength characteristics (rate of force development, RFD; impulse, IMP; and relative RFD, RFD1/6) in the very initial contraction phase (0–50 ms) Data are expressed relative to pre-exercise values (100%). *P < 0.05 different from pre-exercise.
Figure 5
Figure 5
Significant differences in the percentage of Z-lines intact (A), disrupted (B) and destroyed (C) noted at various time points throughout the testing period Most interesting was the significantly higher percentage of Z-lines destroyed in the ES leg when compared with the VOL leg and the significant increase in disrupted Z-lines in the voluntary leg at 5 and 24 h postexercise. *P < 0.05 different from baseline; †P < 0.05 treatment groups different.
Figure 6
Figure 6
Transmission electron microscopical images of longitudinal sections taken 24 h postexercise A and B show predominantly sarcomeric disruption in the VOL muscle (A) and sarcomeric damage in the ES muscle (B). Magnified images of Z-lines taken at 24 h postexercise show representative images of Z-lines intact (C); Z-lines distrupted (D) and Z-lines destroyed (E). Scale bar for A and B represents 1 μm; scale bars in C–E represent 0.5 μm.
Figure 8
Figure 8
Detection of gross disturbance to the myofibre No desmin-negative myofibres were noted in the VOL muscle (A; 192 h postexercise) at any time point measured. In contrast, there was a significant increase in the number of myofibres in the ES leg that were not immunoreactive to desmin and showed classic signs of myofibre necrosis (B; 192 h postexercise). Scale bars represent 50 μm.
Figure 7
Figure 7
A significant increase in the number of desmin-negative myofibres was noted in both the ES and the VOL leg at 24, 96 and 192 h postexercise when compared with the baseline sample *P < 0.05 different from baseline; †P < 0.05 treatment groups different.
Figure 9
Figure 9
A significant increase in the area immunoreactive for tenascin C is seen when compared with baseline for both treatment groups No significant difference was noted between the two groups. *P < 0.05 different from baseline.
Figure 10
Figure 10
Expression of N-CAM in mononuclear cells in the satellite cell position A significant increase in the number of mononuclear cells expressing N-CAM was noted in the VOL leg at 96 and 192 h postexercise. A significant difference was noted in the number of mononuclear cells expressing N-CAM in the ES leg at 192 h postexercise when compared with both baseline and the VOL leg. *P < 0.05 different from baseline; †P < 0.05 treatment groups different.
Figure 11
Figure 11
Expression of PAx-7 in mononuclear cells in the satellite cell position A significant increase in the number of mononuclear cells expressing Pax-7 was noted in the VOL leg at 96 h postexercise. A significant difference was noted in the number of mononuclear cells expressing Pax-7 in the ES leg at 192 h postexercise when compared with both baseline and the VOL leg. *P < 0.05 different from baseline; †P < 0.05 treatment groups different.
Figure 12
Figure 12
Expression of myogenin positive cells Terminal differentiation of satellite cells was not noted at any time point in the VOL leg. In contrast, a significant increase in myogenin expression, hence terminal differentiation of satellite cells, was displayed in the ES leg at 192 h when compared with both baseline and the VOL leg. *P < 0.05 different from baseline; †P < 0.05 treatment groups different.
Figure 13
Figure 13
Schema depicting the stages of expression of various markers associated with satellite cells (SC) and myogenic progenitor cells (MPC) in human skeletal muscle The Pax-7 and N-CAM are expressed in activated SC; however, the Pax-7 appears to be switched off in the satellite cells that continue through to terminal differentiation (MPC). The growth factors myogenic factor 5 (Myf5), MyoD, myogenin and myogenic regulatory factor 4 (Mrf4) are then expressed at varying stages throughout the activation and differentiation cycle as depicted. Schema derived from Zammit et al. (2004).

References

    1. Aagaard P, Simonsen E, Andersen J, Magnusson P, Dyhre-Poulsen P. Increased rate of force development and neural drive of human skeletal muscle following resistance training. J Appl Physiol. 2002;93:1318–1326. - PubMed
    1. Aagaard P, Simonsen E, Andersen J, Magnusson P, Halkjær-Kristensen J, Dyhre-Poulsen P. Neural inhibition during maximal eccentric and concentric quadriceps contraction: effects of resistance training. J Appl Physiol. 2000;89:2249–2257. - PubMed
    1. Aagaard P, Simonsen EB, Trolle M, Bangsbo J, Klausen K. Moment and power generation during maximal knee extensions performed at low and high speeds. Eur J Appl Physiol. 1994;69:376–381. - PubMed
    1. Barash IA, Mathew L, Ryan AF, Chen J, Lieber RL. Rapid muscle-specific gene expression changes after a single bout of eccentric contractions in the mouse. Am J Physiol Cell Physiol. 2004;286:C355–C364. - PubMed
    1. Barash IA, Peters D, Friden J, Lutz GJ, Lieber RL. Desmin cytoskeletal modifications after a bout of eccentric exercise in the rat. Am J Physiol Regul Integr Comp Physiol. 2002;283:R958–R963. - PubMed

Publication types

MeSH terms