. 2007 Nov;189(22):8165-78.
doi: 10.1128/JB.00586-07. Epub 2007 Jun 22.

BifA, a cyclic-Di-GMP phosphodiesterase, inversely regulates biofilm formation and swarming motility by Pseudomonas aeruginosa PA14

Affiliations

BifA, a cyclic-Di-GMP phosphodiesterase, inversely regulates biofilm formation and swarming motility by Pseudomonas aeruginosa PA14

Sherry L Kuchma et al. J Bacteriol. 2007 Nov.

Abstract

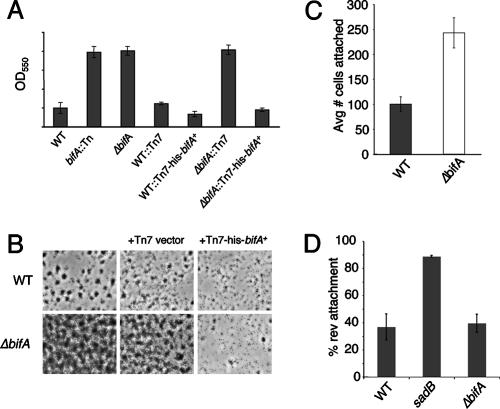
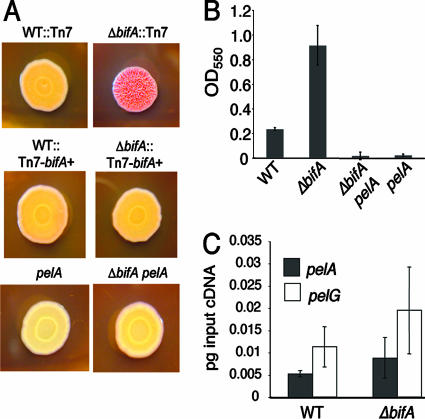
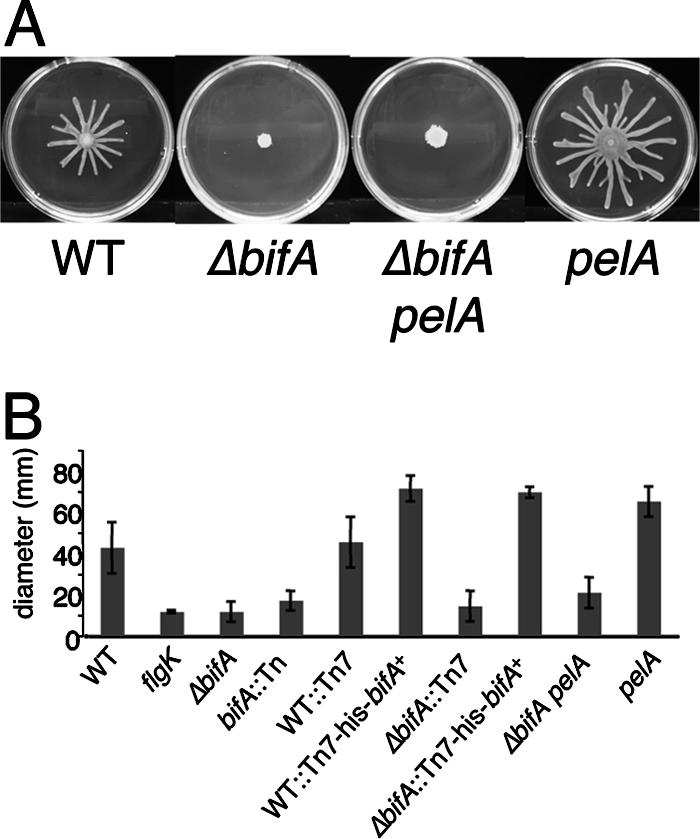
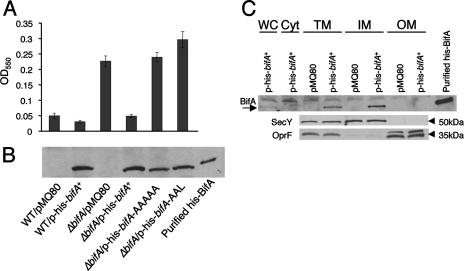
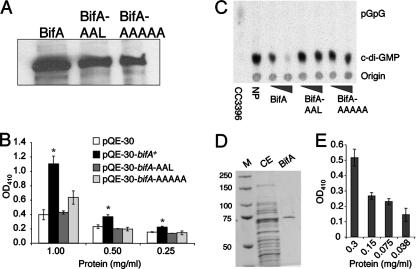
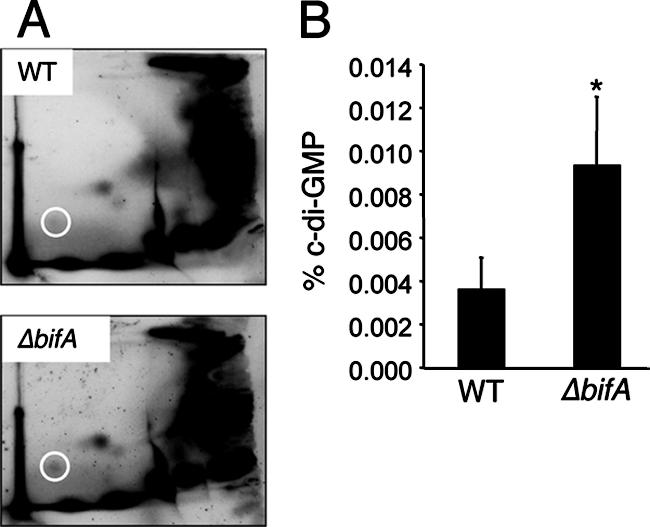
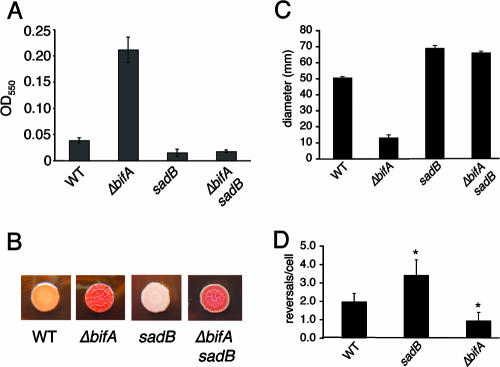
The intracellular signaling molecule, cyclic-di-GMP (c-di-GMP), has been shown to influence bacterial behaviors, including motility and biofilm formation. We report the identification and characterization of PA4367, a gene involved in regulating surface-associated behaviors in Pseudomonas aeruginosa. The PA4367 gene encodes a protein with an EAL domain, associated with c-di-GMP phosphodiesterase activity, as well as a GGDEF domain, which is associated with a c-di-GMP-synthesizing diguanylate cyclase activity. Deletion of the PA4367 gene results in a severe defect in swarming motility and a hyperbiofilm phenotype; thus, we designate this gene bifA, for biofilm formation. We show that BifA localizes to the inner membrane and, in biochemical studies, that purified BifA protein exhibits phosphodiesterase activity in vitro but no detectable diguanylate cyclase activity. Furthermore, mutational analyses of the conserved EAL and GGDEF residues of BifA suggest that both domains are important for the observed phosphodiesterase activity. Consistent with these data, the DeltabifA mutant exhibits increased cellular pools of c-di-GMP relative to the wild type and increased synthesis of a polysaccharide produced by the pel locus. This increased polysaccharide production is required for the enhanced biofilm formed by the DeltabifA mutant but does not contribute to the observed swarming defect. The DeltabifA mutation also results in decreased flagellar reversals. Based on epistasis studies with the previously described sadB gene, we propose that BifA functions upstream of SadB in the control of biofilm formation and swarming.


Figures

FIG. 1.
FIG. 1.
Biofilm phenotypes of bifA mutants. (A) Quantification of biofilms formed by the WT, the bifA::Tn mutant and the ΔbifA mutant in the 96-well microtiter dish assay. Also shown are the single-copy complemented strains of the WT and the ΔbifA mutant carrying an insertion of either the Tn7 element alone (WT::Tn7 and ΔbifA::Tn7) or the Tn7 harboring a His-tagged version of bifA (WT::Tn7-His-bifA+ and ΔbifA::Tn7-His-bifA+). Cells were grown in M63 with glucose, MgSO4, and CAA for 6 h at 37°C prior to crystal violet staining. Crystal violet was solubilized in 30% glacial acetic acid and measured at OD550. (B) ALI assay. Top-down phase-contrast images of the WT and the ΔbifA mutant either alone or carrying insertions of the Tn7 (Tn7 vector) or the Tn7 with His-tagged bifA (Tn7-His-bifA+) are shown. Cells were grown in a 24-well plate for 6 h at 37°C, and images were recorded at a magnification of ×1,400. (C) Quantification of initial attachment of the WT and the ΔbifA mutant. Cells were incubated at 37°C for 30 min. Images were recorded at a magnification of ×1,400 over eight fields of view for each strain. The graph indicates the average number of cells attached to the substratum (n = 8) for each strain. (D) Quantification of reversible attachment of the WT, the sadB mutant and the ΔbifA mutant. Strains were incubated in 24-well plates for 5 min at 37°C. Time-lapse images were captured in 1-min intervals and converted to QuickTime movies for analysis. Irreversibly attached cells were scored as cells that did not move during the 1-min interval and were attached by the long axis of the cell. Reversibly attached cells were those that moved during the interval and were attached by a cell pole.
FIG. 2.
FIG. 2.
pelA is required for the enhanced CR binding and hyperbiofilm phenotypes of the ΔbifA mutant. (A) Representative images of CR binding. Shown are the WT::Tn7, the ΔbifA::Tn7 mutant, the complemented strains WT::Tn7-His-bifA+ and ΔbifA::Tn7-His-bifA+, the pelA mutant, and the ΔbifA pelA double mutant. Plates were incubated for 24 h at 37°C, followed by 48 h at room temperature. (B) Quantification of CV-stained biofilms. Strains were grown in M63 with glucose, MgSO4 and CAA for 24 h prior to CV staining. (C) qRT-PCR analysis of pelA and pelG expression in agar-grown colonies of the WT and the ΔbifA mutant. Expression is plotted as picograms of input cDNA for each strain.
FIG. 3.
FIG. 3.
The pel-derived polysaccharide does not contribute to the swarming defects of the ΔbifA mutant. (A) Representative images of the WT, the ΔbifA mutant, the ΔbifA pelA double mutant, and the pelA mutant swarms after 16 h at 37°C. (B) Graph showing the average diameter (in millimeters) of swarms from triplicate platings for each strain.
FIG. 4.
FIG. 4.
Assessment of function, stability, and cellular localization of BifA. (A) Assessment of the ability of the bifA gene, the bifA-AAAAA (GGDEF→AAAAA) mutant, and the bifA-AAL (EAL→AAL) mutant to complement the ΔbifA mutant when provided on an arabinose-inducible plasmid (pMQ80). The graph shows the quantification of biofilm formed by the WT and the ΔbifA mutant carrying either the pMQ80 vector alone or pMQ80 containing the His-tagged bifA gene (p-his-bifA+). Also shown is the quantification of biofilm formed by the ΔbifA mutant carrying pMQ80 with the bifA-AAAAA mutant (p-his-bifA-AAAAA) or the bifA-AAL mutant (p-his-bifA-AAL). Cells were grown for 6 h in the presence of 0.5% arabinose prior to CV staining. (B) Evaluation of expression and stability of WT BifA, BifA-AAAAA, and BifA-AAL proteins expressed from the pMQ80 constructs in panel A. Western blot showing the level of BifA expressed under the same conditions used in the biofilm assays in panel A. Equal amounts of cells were lysed and separated by SDS-PAGE. BifA was detected by using an anti-penta-His antibody. Purified His-BifA served as a control. (C) Cellular localization of BifA. Cellular fractions of the ΔbifA mutant carrying either vector alone (pMQ80) or vector containing the bifA gene (p-his-bifA+) were generated as described previously (see Materials and Methods). Approximately 1 μg of total protein from each fraction was separated by SDS-PAGE. Fractions are indicated as whole-cell (WC), soluble cytoplasmic (Cyt), total membrane (TM), inner-membrane (IM), and outer-membrane (OM) fractions. Western analysis was performed with either an anti-penta-His antibody, an anti-SecY antibody, or an anti-OprF antibody. The arrow indicates the BifA band. Purified His-BifA served as a control. SecY (∼50 kDa) served as a control for inner- membrane localization and OprF (∼35 kDa) served as an outer-membrane marker.
FIG. 5.
FIG. 5.
Analysis of PDE activity of BifA in vitro. (A) Western blot showing the levels of WT His-BifA, His-BifA-AAL, and His-BifA-AAAAA protein in crude extracts of E. coli cells carrying either pQE-30 with the bifA gene, the bifA-AAL mutant, or the bifA-AAAAA mutant. Crude extracts were prepared as described previously (see Materials and Methods). Equal quantities (3 μg) of total protein were separated by SDS-PAGE and detected by Western blotting with an anti-penta-His antibody. (B) Assessment of PDE activity in the crude extracts (described above) compared to control extract (prepared from E. coli carrying the pQE-30 vector only) using the substrate bis-pNPP. The graph shows the dose-response curve generated by twofold serial dilutions of crude extract incubated in the presence of bis-pNPP for 20 min. The release of p-nitrophenol was quantified at OD410. The asterisk indicates statistical significance (P < 0.05). (C) Detection of PDE activity in crude extracts using the radiolabeled substrate, c-di-GMP. Crude extracts containing either WT BifA, BifA-AAL, and BifA-AAAAA mutant proteins in increasing concentrations (3 or 9 μg of protein per reaction) were incubated with c-di-GMP. A no-protein (NP) control lane indicates the amount of input substrate. CC3396 served as a positive control for PDE activity, converting c-di-GMP to the linear form, pGpG. (D) Purification of His-tagged BifA. His-tagged BifA was purified from crude extracts using a His-Trapp-FF NiSO4 column. The purity of BifA was evaluated by SDS-PAGE separation and Coomassie blue staining (lane 3) compared to crude extract (CE). The sizes of markers (M) in lane 1 are indicated in kilodaltons. (E) PDE activity of purified His-BifA. The graph shows a dose-response curve generated by twofold serial dilutions of BifA assayed as described in panel B.
FIG. 6.
FIG. 6.
The bifA gene influences c-di-GMP levels in vivo. (A) Autoradiographs of representative two-dimensional TLC plates used to separate [32P]orthophosphate-labeled, acid-extracted whole-cell extracts prepared from both the WT and the ΔbifA mutant. The circle indicates the position of c-di-GMP. (B) Quantification of c-di-GMP levels. Autoradiographs were analyzed using the Storm 860 and ImageQuant software (v5.1). The percentage of label incorporated into c-di-GMP was normalized to total 32P labeling and expressed as the percentage of c-di-GMP. The asterisk indicates statistical significance (P < 0.02).
FIG. 7.
FIG. 7.
Genetic interactions between bifA and sadB in relation to biofilm formation, EPS production, and swarming. (A) Quantification of CV-stained biofilm formed by the WT, the ΔbifA mutant, the sadB mutant, and the ΔbifA sadB double mutant. Cells were grown for 8 h prior to CV staining. (B) CR binding by the indicated strains. Plates were incubated for 24 h at 37°C, followed by 48 h at room temperature. (C) Diameter (in millimeters) of swarm zones plotted for each of the indicated strains. Swarm plates were incubated for 16 h at 37°C. (D) Swim reversal frequencies of the indicated strains under high-viscosity (15% Ficoll) conditions are plotted. Approximately 135 total cells were counted per strain to determine the reversal frequency, expressed as the number of reversals per cell. The asterisks indicate statistical significance (P < 0.0005).

References

    1. Akiyama, Y., and K. Ito. 1985. The SecY membrane component of the bacterial protein export machinery: analysis by new electrophoretic methods for integral membrane proteins. EMBO J. 4:3351-3356. - PMC - PubMed
    1. Aspedon, A., K. Palmer, and M. Whiteley. 2006. Microarray analysis of the osmotic stress response in Pseudomonas aeruginosa. J. Bacteriol. 188:2721-2725. - PMC - PubMed
    1. Benz, R., and R. E. Hancock. 1981. Properties of the large ion-permeable pores formed from protein F of Pseudomonas aeruginosa in lipid bilayer membranes. Biochim. Biophys. Acta 646:298-308. - PubMed
    1. Bertani, G. 2004. Lysogeny at mid-twentieth century: P1, P2, and other experimental systems. J. Bacteriol. 186:595-600. - PMC - PubMed
    1. Bobrov, A. G., O. Kirillina, and R. D. Perry. 2005. The phosphodiesterase activity of the HmsP EAL domain is required for negative regulation of biofilm formation in Yersinia pestis. FEMS Microbiol. Lett. 247:123-130. - PubMed

Publication types

MeSH terms

LinkOut - more resources