. 2007 Jun;19(6):1851-65.
doi: 10.1105/tpc.107.050849. Epub 2007 Jun 22.

Inactivation of thioredoxin reductases reveals a complex interplay between thioredoxin and glutathione pathways in Arabidopsis development

Affiliations

Inactivation of thioredoxin reductases reveals a complex interplay between thioredoxin and glutathione pathways in Arabidopsis development

Jean-Philippe Reichheld et al. Plant Cell. 2007 Jun.

Abstract

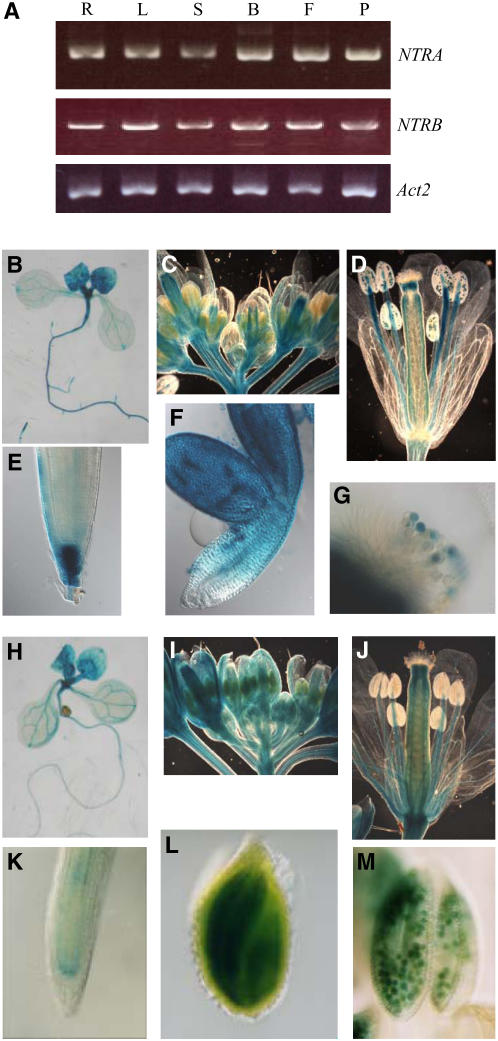
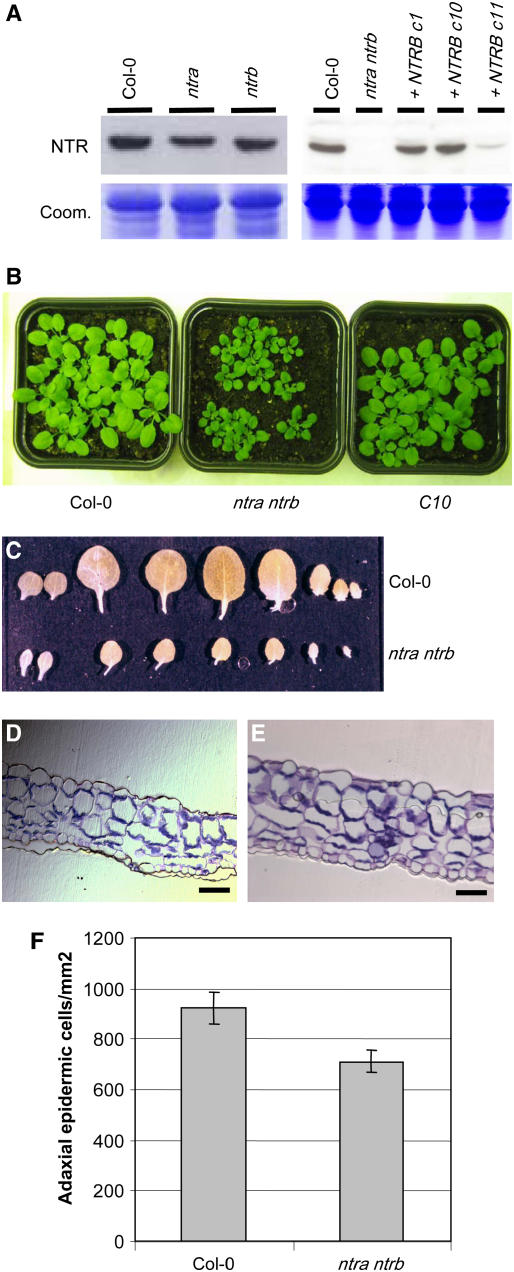
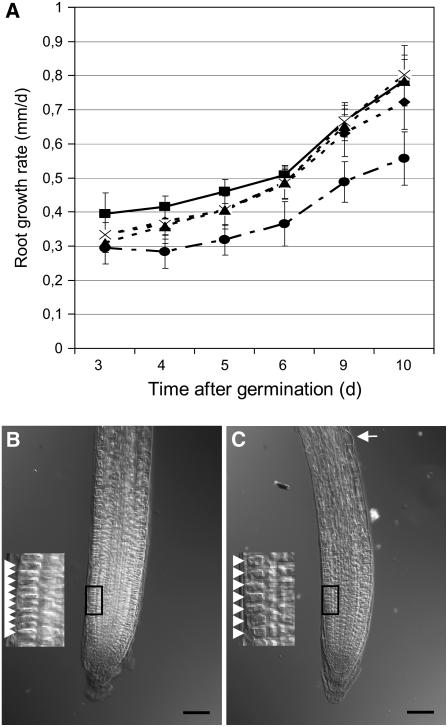
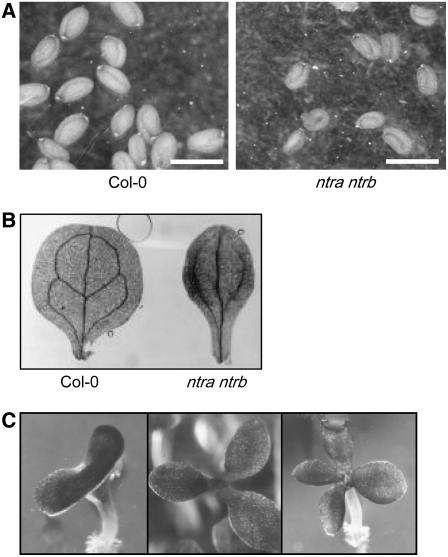
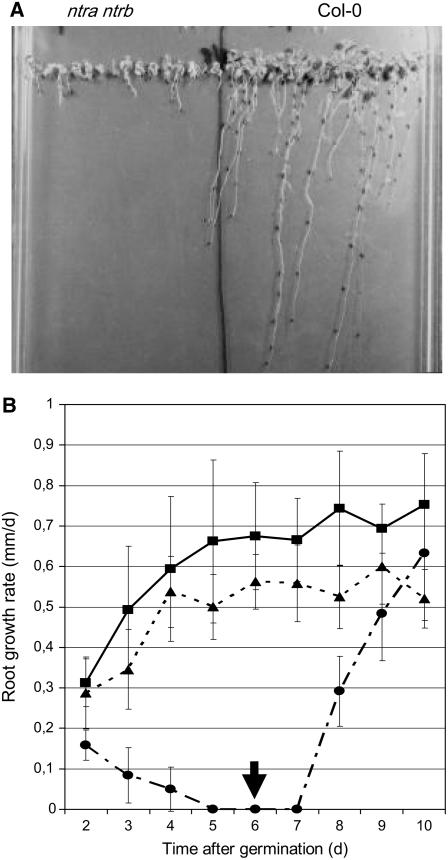
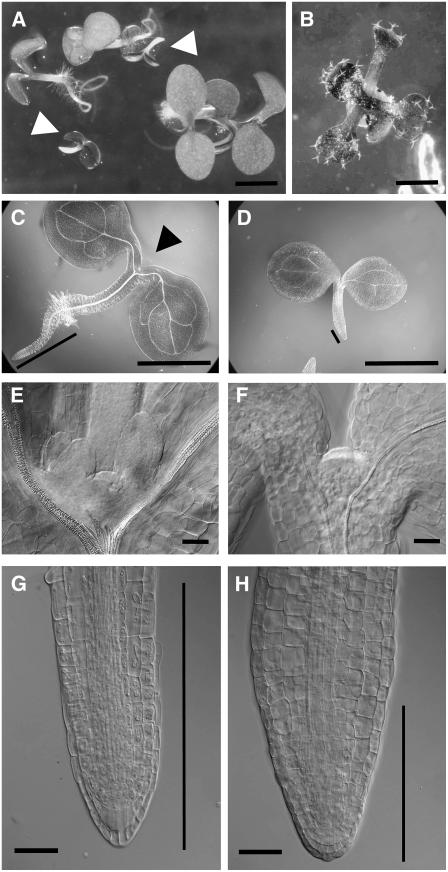
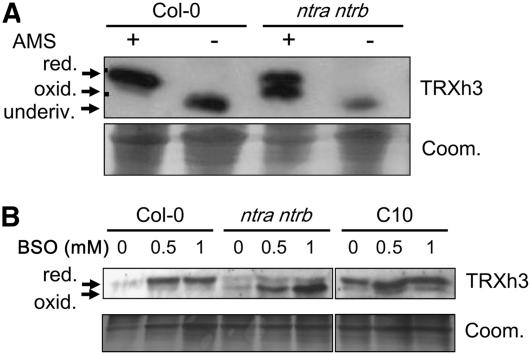
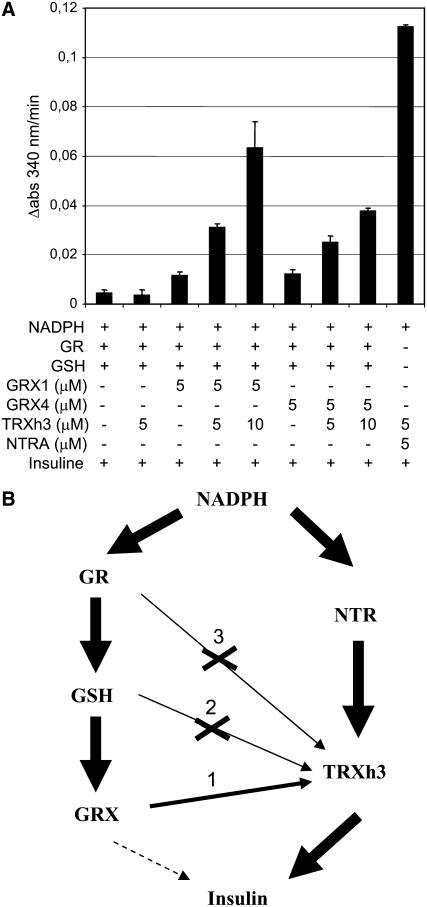
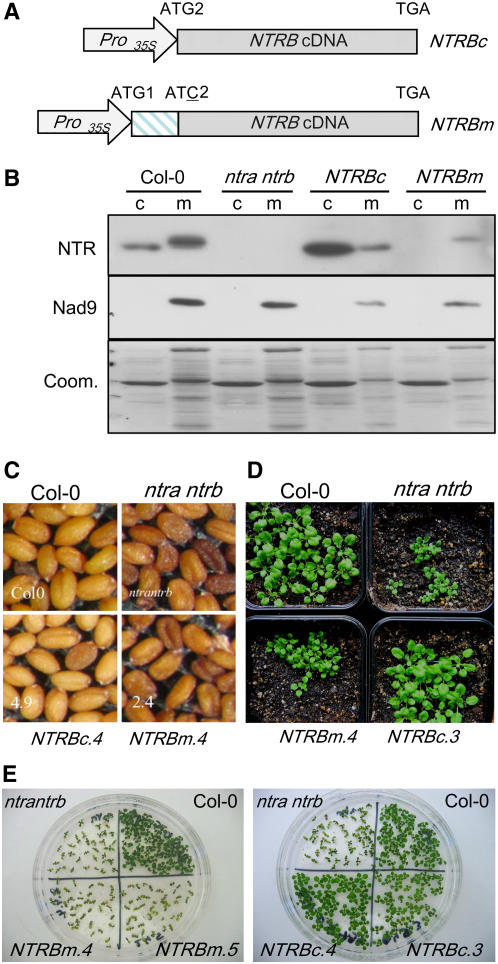
NADPH-dependent thioredoxin reductases (NTRs) are key regulatory enzymes determining the redox state of the thioredoxin system. The Arabidopsis thaliana genome has two genes coding for NTRs (NTRA and NTRB), both of which encode mitochondrial and cytosolic isoforms. Surprisingly, plants of the ntra ntrb knockout mutant are viable and fertile, although with a wrinkled seed phenotype, slower plant growth, and pollen with reduced fitness. Thus, in contrast with mammals, our data demonstrate that neither cytosolic nor mitochondrial NTRs are essential in plants. Nevertheless, in the double mutant, the cytosolic thioredoxin h3 is only partially oxidized, suggesting an alternative mechanism for thioredoxin reduction. Plant growth in ntra ntrb plants is hypersensitive to buthionine sulfoximine (BSO), a specific inhibitor of glutathione biosynthesis, and thioredoxin h3 is totally oxidized under this treatment. Interestingly, this BSO-mediated growth arrest is fully reversible, suggesting that BSO induces a growth arrest signal but not a toxic accumulation of activated oxygen species. Moreover, crossing ntra ntrb with rootmeristemless1, a mutant blocked in root growth due to strongly reduced glutathione synthesis, led to complete inhibition of both shoot and root growth, indicating that either the NTR or the glutathione pathway is required for postembryonic activity in the apical meristem.


Figures

Figure 1.
Figure 1.
Expression of NTRA and NTRB Genes. (A) Steady state levels of NTRA and NTRB mRNAs in different plant organs. Semiquantitative RT-PCR was performed using gene-specific (NTRA and NTRB) and reference gene (Act2) primers. Twenty-eight PCR cycles were used to amplify each cDNA. R, roots; L, rosette leaves; S, stems; B, flower buds; F, flowers; P, in vitro plantlets. (B) to (G) Localization of NTRA:GUS activity. (H) to (M) Localization of NTRB:GUS activity. Activity was highlighted in the shoot apex, young emerging leaves, and vascular system ([B] and [H]); in young floral tissues ([C] and [I]); in stamen filament, transmission tissues in the pistil, and ripening pollen grains ([D], [J], and [M]); in the root meristem, mainly in the central columella ([E]; NTRA:GUS) and in the region adjacent to the central zone ([K]; NTRB:GUS); in the whole tissues of the mature embryo ([F] and [L]); and, finally, in the germinating pollen tube ([G]; NTRA:GUS).
Figure 2.
Figure 2.
Slower Growth of the ntra ntrb Mutant Is Complemented by the NTRB Gene. (A) NTR protein detection in ntr mutant plants. Protein gel blots of crude protein extracts (20 μg) were probed with antibodies directed against NTRB. Fractions were prepared from wild-type (Col-0), ntra, ntrb, and ntra ntrb homozygous plants and with three lines of the ntra ntrb mutants complemented with the NTRB gene (C1, C10, and C11). Protein loading control is shown by Coomassie blue staining. (B) Phenotype of the wild type (Col-0), ntra ntrb, and a complemented ntra ntrb line, C10, at 17 d after germination. Plants were grown in soil at 22°C and 70% RH under a 16-h light (4500 lux)/8-h dark regime. C1 and C11 lines have the same phenotype as line C10. (C) Comparison of leaf shape in wild-type and ntra ntrb plants at the same stage and grown in the same conditions as in (B). Notice the ovoid shape of the cotyledons in ntra ntrb plants and the lower number of leaves (one leaf less than Col-0), indicative of a slight delay in leaf emergence. (D) and (E) Cross sections of the third rosette leaves of wild-type (D) and ntra ntrb (E) plants at the same stage and grown in the same conditions as in (B). Note the conserved ultrastructure of the leaf. Bars = 10 μm. (F) Density of adaxial epidermal cells in wild-type (Col-0) and ntra ntrb plants at the same stage and grown in the same conditions as in (B). Data are means ± se; n ≥ 12.
Figure 3.
Figure 3.
Slower Root Growth of the ntra ntrb Mutant. (A) Daily root growth was measured on the wild type (squares), ntra ntrb (circles), and complemented lines (C1, crosses, C10, triangles, C11, diamonds). Plants were grown on MS/2 vertical agar plates at 22°C under a 16-h light (4500 lux)/8-h dark regime. Data are means ± se; n ≥ 45. (B) and (C) Phenotypes of the primary root meristems of wild-type (B) and ntra ntrb (C) plants cultivated as in (A) and observed for 10 d after germination. Note the higher epifluorescence of the Col-0 meristem compared with the ntra ntrb mutant, suggesting a higher cell density. Higher magnification of the meristematic zone reveals files of epidermal cells that are bigger in the mutant than in Col-0 roots (arrowheads). Bigger cells are also observed in the elongation zone of the ntra ntrb roots. The arrow at top in (C) shows an emerging root hair, indicating the shorter size of the root tip/elongation zone in the ntra ntrb mutant. Bars = 20 μm.
Figure 4.
Figure 4.
Wrinkled Seeds of the ntra ntrb Mutant. (A) Comparison of mature seeds of wild-type (Col-0) and ntra ntrb plants. Note the wrinkled phenotype of the ntra ntrb seeds. Bars = 1 mm. (B) Comparison of the cotyledons of wild-type (Col-0) and ntra ntrb plants. Seeds were germinated on MS/2 medium under a 16-h light/8-h dark regime. Cotyledons were collected at 3 d after germination, cleared in Hoyer's solution, and observed with a binocular microscope. Note the less developed vasculature of the ntra ntrb cotyledon. (C) Anomalous cotyledon numbers were observed in the ntra ntrb mutant (3 to 5% of plants).
Figure 5.
Figure 5.
Hypersensitivity of the ntra ntrb Mutant to Glutathione Biosynthesis Inhibition by BSO. ntra ntrb and Col-0 plants were grown under the specific glutathione biosynthesis inhibitor BSO. (A) Seeds were soaked on vertical MS/2 agar plates supplemented by 0.5 mM BSO and grown under a 16-h light/8-h dark regime. Note the smaller size of the shoot, indicating that BSO also affects shoot development. (B) Daily root growth was measured in the wild type (squares) ntra ntrb (circles), and ntra ntrb complemented with NTRB (triangles; C10). At 6 d after germination, ntra ntrb plants were transferred to MS/2 plates without BSO (arrow) and root growth was measured further. Data are means ± se; n ≥ 45.
Figure 6.
Figure 6.
Phenotype of the ntra ntrb rml1 Mutant. (A) Progeny of ntra/ntra ntrb/ntrb rml1/RML1 plants at 8 d after germination on MS/2 medium. Homozygous ntra/ntra ntrb/ntrb rml1/rml1 plants are indicated by arrows. (B) Growth recovery of a ntra/ntra ntrb/ntrb rml1/rml1 plant that was transferred to MS/2 medium supplemented with 1 mM GSH. (C) and (D) Phenotypes of rml1 (C) and ntra ntrb rml1 (D) homozygous mutants at 8 d after germination on MS/2 medium. Leaf primordia are indicated by an arrow in (C). Approximate root length is indicated by black lines. Note that root hairs are emerging in rml1 plants, in contrast with ntra ntrb rml1 plants. (E) and (F) Magnification of the shoot meristem of rml1 (E) and ntra ntrb rml1 (F) homozygous mutants at 8 d after germination on MS/2 medium. Note the absence of leaf primordia in ntra ntrb rml1 (F) in contrast with rml1 (E). (G) and (H) Primary root meristematic zones of rml1 (G) and ntra ntrb rml1 (H) homozygous mutants at 8 d after germination on MS/2 medium. Black lines indicate the approximate lengths of the division and elongation zones in rml1, the differentiation zone being out of frame (G). In (H), the black line represents the whole root of ntra ntrb rml1. Bars = 1 mm in (A) to (D) and 20 μm in (E) to (H).
Figure 7.
Figure 7.
Redox State of Thioredoxin At TRXh3 in the ntra ntrb Mutant. (A) Col-0 and ntra ntrb plants were grown on MS/2 agar plates and collected at 10 d after germination. Protein extracts (30 μg) were treated (+) or not (−) with AMS and resolved on nonreducing SDS-PAGE gels, transferred on nitrocellulose filters, and probed with antibodies against At TRXh3. The mobilities of the oxidized (oxid.), reduced (red.), and underivatized (underiv.) forms are represented. Note that the shift of the oxidized form, compared with the underivatized sample, is due to the presence of a third Cys located in the N-terminal part of At TRXh3. This Cys is not redox-active and is constitutively reduced. (B) The wild type (Col-0), ntra ntrb, and complemented line C10 were treated with increasing concentrations of BSO. The redox state of TRXh3 was analyzed after AMS alkylation of crude protein extracts, as described for (A).
Figure 8.
Figure 8.
Biochemical Activity of At GRX on At TRXh3. (A) Activity of different Arabidopsis thioredoxin systems determined by the insulin-disulfide reduction assay. The rate of NADPH oxidation was followed at 340 nm, coupled to insulin reduction by At TRXh3 and by various combinations of NTR, GR, GSH, At GRX1, or At GRX4. Data are means ± se (n = 5). (B) Schematic representation of the alternative reduction of At TRXh3 by the NGS. Insulin is efficiently reduced by the NTS pathway (NADPH/NTR/TRXh3). However, it is hardly reduced by the NGS pathway (NADPH/GR/GSH/GRX). In the absence of NTR, TRXh3 is alternatively reduced by the NGS pathway (arrow 1), leading to a consistent level of insulin reduction. However, an incomplete NGS pathway lacking GRX (arrow 2) or GSH/GRX (arrow 3) is unable to reduce TRXh3.
Figure 9.
Figure 9.
Differential Complementation of the ntra ntrb Mutant by Cytoplasmic or Mitochondrial Isoforms of NTRB. (A) Schematic representation of the differential complementation constructs used to express either the cytosolic (NTRBc) or mitochondrial (NTRBm) cDNA of NTRB in ntra ntrb plants. In order to express the cytosolic isoform of the NTRB protein, the ntra ntrb mutant was complemented with the NTRB cDNA cloned at the more downstream ATG (ATG2) under the control of the Pro35S. To express the mitochondrial isoform, the cDNA was cloned at the upstream ATG (ATG1) and ATG2 was mutated to ATC to avoid initiation of the cytosolic isoform. The respective transformants were called NTRBc and NTRBm. (B) Subcellular localization of the NTRB proteins in complemented lines. Protein gel blot analyses of cytosolic (c) and mitochondrial (m) fractions probed with antibodies directed against NTRB and Nad9 are shown. The fractions were prepared from wild-type (Col-0), ntra ntrb, and NTRBc and NTRBm complemented plants. Membrane loading control is shown by protein staining with Coomassie blue. (C) Seed phenotypes of the wild type (Col-0), ntra ntrb, and NTRBc and NTRBm complemented lines. (D) Plant growth phenotypes of the wild type (Col-0), ntra ntrb, and NTRBc and NTRBm complemented lines. (E) Growth of the wild type (Col-0), ntra ntrb, and NTRBc (c3 and c4) and NTRBm (m4, m5) complemented lines on 0.5 mM BSO.

Similar articles

Cited by

References

    1. Alonso, J.M., et al. (2003). Genome-wide insertional mutagenesis of Arabidopsis thaliana. Science 301 653–657. - PubMed
    1. Altschul, S.F., Madden, T.L., Schaffer, A.A., Zhang, J., Zhang, Z., Miller, W., and Lipman, D.J. (1997). Gapped BLAST and PSI-BLAST: A new generation of protein database search programs. Nucleic Acids Res. 25 3389–3402. - PMC - PubMed
    1. Arabidopsis Genome Initiative (2000). Analysis of the genome sequence of the flowering plant Arabidopsis thaliana. Nature 408 796–815. - PubMed
    1. Arner, E.S., and Holmgren, A. (2000). Physiological functions of thioredoxin and thioredoxin reductase. Eur. J. Biochem. 267 6102–6109. - PubMed
    1. Balmer, Y., Vensel, W.H., Tanaka, C.K., Hurkman, W.J., Gelhaye, E., Rouhier, N., Jacquot, J.-P., Manieri, W., Schurmann, P., Droux, M., and Buchanan, B.B. (2004). Thioredoxin links redox to the regulation of fundamental processes of plant mitochondria. Proc. Natl. Acad. Sci. USA 101 2642–2647. - PMC - PubMed

Publication types

MeSH terms

LinkOut - more resources