. 2007 Jun;19(6):1964-79.
doi: 10.1105/tpc.106.048744. Epub 2007 Jun 22.

In vivo visualization of Mg-protoporphyrin IX, a coordinator of photosynthetic gene expression in the nucleus and the chloroplast

Affiliations

In vivo visualization of Mg-protoporphyrin IX, a coordinator of photosynthetic gene expression in the nucleus and the chloroplast

Elisabeth Ankele et al. Plant Cell. 2007 Jun.

Abstract

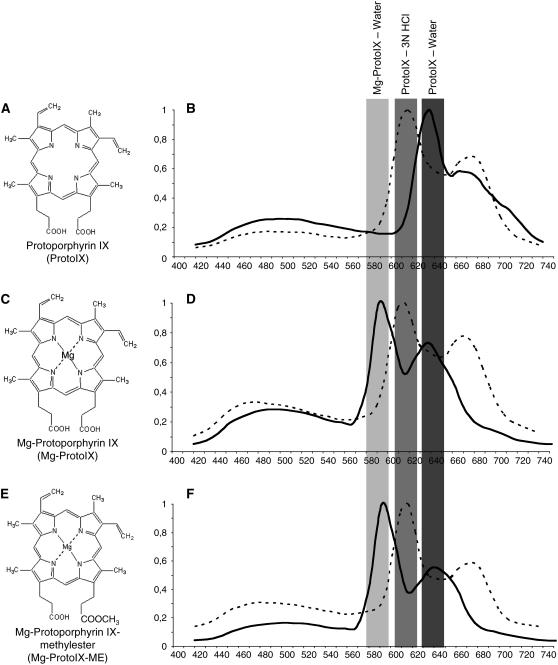
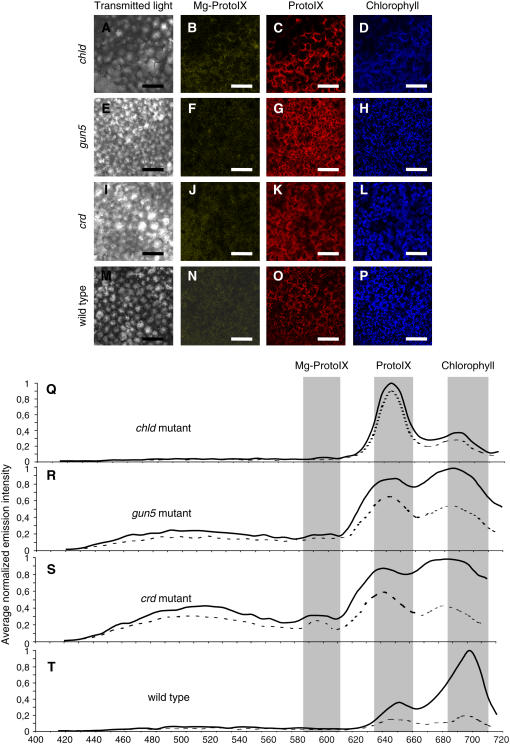
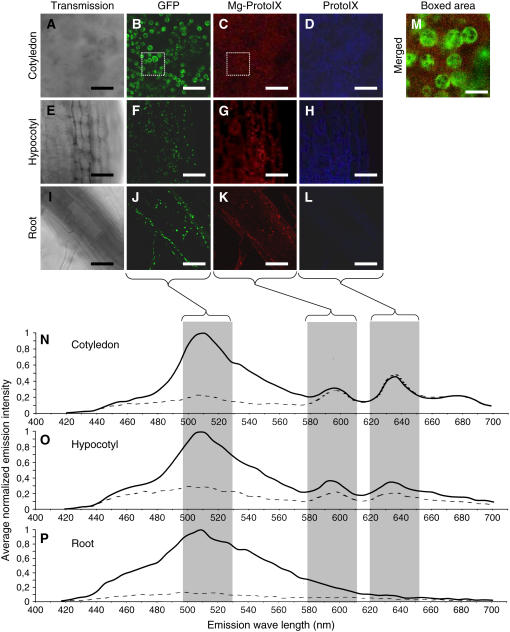
The photosynthetic apparatus is composed of proteins encoded by genes from both the nucleus and the chloroplast. To ensure that the photosynthetic complexes are assembled stoichiometrically and to enable their rapid reorganization in response to a changing environment, the plastids emit signals that regulate nuclear gene expression to match the status of the plastids. One of the plastid signals, the chlorophyll intermediate Mg-ProtoporphyrinIX (Mg-ProtoIX) accumulates under stress conditions and acts as a negative regulator of photosynthetic gene expression. By taking advantage of the photoreactive property of tetrapyrroles, Mg-ProtoIX could be visualized in the cells using confocal laser scanning spectroscopy. Our results demonstrate that Mg-ProtoIX accumulated both in the chloroplast and in the cytosol during stress conditions. Thus, the signaling metabolite is exported from the chloroplast, transmitting the plastid signal to the cytosol. Our results from the Mg-ProtoIX over- and underaccumulating mutants copper response defect and genome uncoupled5, respectively, demonstrate that the expression of both nuclear- and plastid-encoded photosynthesis genes is regulated by the accumulation of Mg-ProtoIX. Thus, stress-induced accumulation of the signaling metabolite Mg-ProtoIX coordinates nuclear and plastidic photosynthetic gene expression.


Figures

Figure 1.
Figure 1.
Calibration and Verification of Detection of Tetrapyrroles Using Confocal Laser Scanning Spectroscopy. Emission spectra detected using confocal laser scanning spectroscopy from authentic standards for tetrapyrroles ProtoIX ([A] and [B]), Mg-ProtoIX ([C] and [D]), and Mg-ProtoIX-ME ([E] and [F]). Emission spectra before (solid line) and after (dotted line) removal of Mg from the protoporphyrin ring by acid from Mg-ProtoIX (D) and Mg-ProtoIX-Me (F).
Figure 2.
Figure 2.
HPLC Traces of Tetrapyrrole Standards and Sample Used for Visualization. HPLC traces for ProtoIX (A), Mg-ProtoIX (B), Mg-ProtoIX-ME (C), and wild-type (D) samples grown on norflurazon (NF) following ALA feeding.
Figure 3.
Figure 3.
Verification of Emission Signals from Specific Tetrapyrroles Using Mutants Affected in the Synthesis of Tetrapyrroles. (A) to (P) Emission using confocal laser scanning spectroscopy from chld ([A] to [D]), gun5 ([E] to [H]), crd ([I] to [L]), and wild-type ([M] to [P]) control seedlings that were ALA fed. Emissions from cotyledons are shown, and representative images were taken at 585 to 615 nm, 627 to 657 nm, and 680 to 710 nm for the specific emission of Mg-ProtoIX ([B], [F], [J], and [N]), ProtoIX ([C], [G], [K], and [O]), and chlorophyll ([D], [H], [L], and [P]), respectively. Bars = 50 μm. (Q) to (T) Corresponding fluorescence emission spectra are shown from the plastids (solid line) and cytosol (dotted line). Emission spectra were normalized to the maximum value for each measurement, and overall spectrum was calculated by averaging measurements of 10 positions overlapping (solid line) and excluding (dotted line) chloroplasts.
Figure 4.
Figure 4.
Verification of Emission Signals from Specific Tetrapyrroles Using Mutants Grown on Norflurazon. (A) to (L) Emission using confocal laser scanning microscopy from gun5 ([A] to [D]), crd ([E] to [H]), and wild-type ([I] to [L]) norflurazon-grown and ALA-fed seedlings. Emissions from cotyledons are shown and representative images were taken at 585 to 615 nm, 627 to 657 nm, and 680 to 710 nm for the specific emission of Mg-ProtoIX ([B], [F], and [J]), ProtoIX ([C], [G], and [K]), and chlorophyll ([D], [H], and [L]), respectively. Bars = 50μm. (M) to (O) Corresponding fluorescence emission spectra are shown from the plastids (solid line) and cytosol (dotted line). Emission spectra were normalized to the maximum value for each measurement, and overall spectrum was calculated by averaging measurements of 10 positions overlapping (solid line) and excluding (dotted line) chloroplasts.
Figure 5.
Figure 5.
Visualization of Tetrapyrrole Accumulation. Accumulation of tetrapyrroles visualized using confocal laser scanning spectroscopy of norflurazon-treated, ALA-fed SCO1:GFP Arabidopsis seedlings. Emission is shown for cotyledon ([A] to [D]), hypocotyl ([E] to [H]), and root ([I] to [L]), and their corresponding fluorescence emission spectra is presented ([N] to [P]). Representative images were retrieved at 507 to 537 nm, 585 to 615 nm, and 627 to 657 nm for specific emission of GFP ([B], [F], and [J]), Mg-ProtoIX ([C], [G], and [K]), and ProtoIX ([D], [H], and [L]), respectively. Emission spectra were normalized to the maximum value for each measurement, and overall spectrum was calculated by averaging measurements of 10 positions overlapping (solid line) and excluding (dotted line) chloroplasts. Merged images of the boxed areas in (B) and (C) with a 1.87-airy pinhole opening are illustrated in (M) (emission windows of 507 to 537 nm for GFP and 585 to 615 nm for Mg-ProtoIX). Bars = 10 μm.
Figure 6.
Figure 6.
TEMs of Chloroplasts. TEMs of Arabidopsis mesophyll cells showing the chloroplast structures in control seedlings grown for 6 d in a 16-h-light/8-h-dark cycle of the wild type (A), gun5 (B), and crd (C) and in seedlings grown for 6 d in a 16-h-light/8-h-dark cycle on 0.5 μM norflurazon for the wild type (D), gun5 (E), and crd (F). Bars = 2 μm.
Figure 7.
Figure 7.
LHCB1 and RBCS Expression Levels. Expression change following norflurazon treatment compared with the green control in the wild type, gun5, and crd of the nuclear-encoded LHCB1 (A) and RBCS (B) genes. Real-time PCR was used, and 18S rRNA was used as internal standard for the different cDNA samples. Each bar presented as log2 represents the mean (±95% confidence interval [CI]) of at least three independent experiments. Seedlings were grown with and without 0.5 μM norflurazon for 6 d in a 16-h-light/8-h-dark cycle.
Figure 8.
Figure 8.
Expression of PEP-Transcribed Plastid-Encoded Genes. Expression change following norflurazon treatment compared with green control in the wild type, gun, and crd mutants of the plastid-encoded PsbA (A), PsbD (B), PsaA (C), PsaC (D), and RbcL (E) genes. Real-time PCR was used, and 18S rRNA was used as internal standard in the different cDNA samples. Each bar presented as log2 represents the mean (±95% CI) of at least three independent experiments. Seedlings were grown with and without 0.5 μM norflurazon for 6 d in a 16-h-light/8-h-dark cycle.
Figure 9.
Figure 9.
Expression of NEP-Transcribed Plastid-Encoded Genes. Expression change following norflurazon treatment compared with green control in the wild type, gun5, and crd mutants of the plastid-encoded RpoB (A), AccD (B), ClpP (C), and Rpl33 (D) genes. Real-time PCR was used, and 18S rRNA was used as internal standard in the different cDNA samples. Each bar presented as log2 represents the mean (±95% CI) of at least three independent experiments. Seedlings were grown with and without 0.5 μM norflurazon for 6 d in a 16-h-light/8-h-dark cycle.
Figure 10.
Figure 10.
Expression of SIG1-6 and RPOPT. Expression change following norflurazon treatment compared with the green control in the wild type, gun5, and crd of the nuclear genes encoding the different sigma factors SIG1 (A), SIG2 (B), SIG3 (C), SIG4 (D), SIG5 (E), and SIG6 (F) genes and the NEP RPOPT (G) using real-time PCR. 18S rRNA was used as internal standard in the different cDNA samples. Each bar presented as log2 represents the mean (±95% CI) of at least three independent experiments. Seedlings were grown with and without 0.5 μM norflurazon for 6 d in a 16-h-light/8-h-dark cycle.

References

    1. Albrecht, V., Ingenfeld, A., and Apel, K. (2006). Characterization of the snowy cotyledon 1 mutant of Arabidopsis thaliana: The impact of chloroplast elongation factor G on chloroplast development and plant vitality. Plant Mol. Biol. 60 507–518. - PubMed
    1. Allison, L.A., Simon, L.D., and Maliga, P. (1996). Deletion of rpoB reveals a second distinct transcription system in plastids of higher plants. EMBO J. 15 2802–2809. - PMC - PubMed
    1. Baba, K., Schmidt, J., Espinosa-Ruiz, A., Villarejo, A., Shiina, T., Gardestrom, P., Sane, A.P., and Bhalerao, R.P. (2004). Organellar gene transcription and early seedling development are affected in the rpoT;2 mutant of Arabidopsis. Plant J. 38 38–48. - PubMed
    1. Beck, C.F. (2005). Signaling pathways from the chloroplast to the nucleus. Planta 222 743–756. - PubMed
    1. Burgess, D., and Taylor, W. (1988). The chloroplast affects the transcription of a nuclear gene family. Mol. Gen. Genet. 214 89–96.

Publication types

MeSH terms

LinkOut - more resources