. 2007 Jul 10;104(28):11796-801.
doi: 10.1073/pnas.0610821104. Epub 2007 Jun 22.

High-field MRI of brain cortical substructure based on signal phase

Affiliations

High-field MRI of brain cortical substructure based on signal phase

Jeff H Duyn et al. Proc Natl Acad Sci U S A. .

Abstract

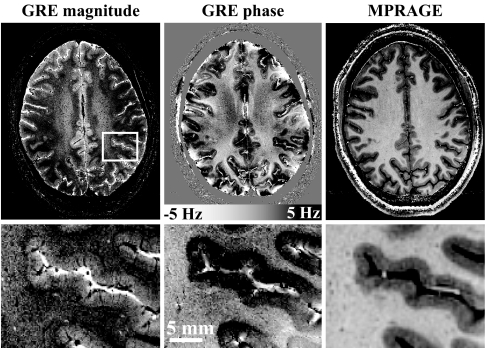
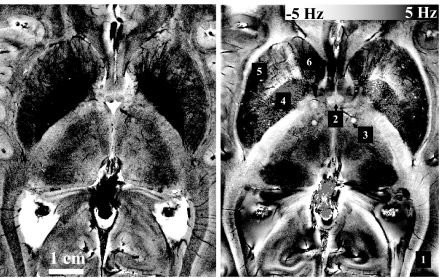
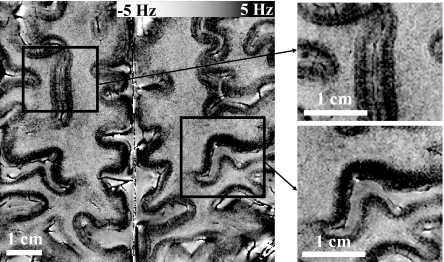
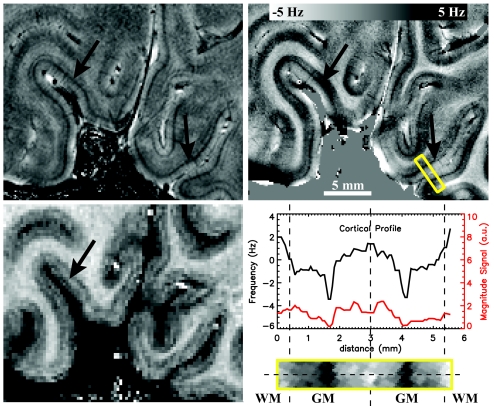
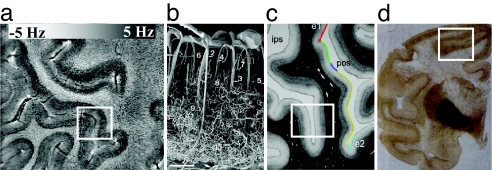
The ability to detect brain anatomy and pathophysiology with MRI is limited by the contrast-to-noise ratio (CNR), which depends on the contrast mechanism used and the spatial resolution. In this work, we show that in MRI of the human brain, large improvements in contrast to noise in high-resolution images are possible by exploiting the MRI signal phase at high magnetic field strength. Using gradient-echo MRI at 7.0 tesla and a multichannel detector, a nominal voxel size of 0.24 x 0.24 x 1.0 mm3 (58 nl) was achieved. At this resolution, a strong phase contrast was observed both between as well as within gray matter (GM) and white matter (WM). In gradient-echo phase images obtained on normal volunteers at this high resolution, the CNR between GM and WM ranged from 3:1 to 20:1 over the cortex. This CNR is an almost 10-fold improvement over conventional MRI techniques that do not use image phase, and it is an approximately 100-fold improvement when including the gains in resolution from high-field and multichannel detection. Within WM, phase contrast appeared to be associated with the major fiber bundles, whereas contrast within GM was suggestive of the underlying layer structure. The observed phase contrast is attributed to local variations in magnetic susceptibility, which, at least in part, appeared to originate from iron stores. The ability to detect cortical substructure from MRI phase contrast at high field is expected to greatly enhance the study of human brain anatomy in vivo.


Conflict of interest statement

The authors declare no conflict of interest.

Figures

Fig. 1.
Fig. 1.
Illustration of image quality of MRI based on image phase. The increased CNR available with MRI phase data allows dramatically improved resolution and shorter scan time. The GRE data (Left and Center) were acquired at a resolution of 240 × 240 μm in a scan time of 6.5 min, whereas the MP-RAGE data (Right) was acquired at a resolution of 480 × 480 μm in a scan time of 20 min. The scale bar in the GRE phase data shows the frequency shifts corresponding to the observed phase differences. (Lower) Magnifications of the area outlined in white on the GRE magnitude image (Left Upper). The macroscopic intensity variations in the phase image are attributed to susceptibility effects related to air–tissue interfaces.
Fig. 2.
Fig. 2.
Example of GRE magnitude and phase data in central brain region acquired at a 240 × 240 μm inplane resolution. Note the many anatomical details visible at this resolution, including veins crossing the optic radiations (box 1), columna fornix (box 2), cross-section of the mamillothalamic tract (box 3), globus pallidus (box 4), putamen (box 5), and head of the caudate nucleus (box 6).
Fig. 3.
Fig. 3.
Intracortical contrast in MRI signal phase. Most cortical regions show a variation intensity that is suggestive of an underlying layer structure (Left). The intensity pattern varies between the different gyri, with clear differences between the upper and lower banks of the central sulcus (Right Lower) and cortices adjacent to the superior frontal sulcus (Right Upper).
Fig. 4.
Fig. 4.
Intracortical contrast in the primary visual cortex. In the GRE magnitude image (Left Upper) and phase image (Right Upper), a darkening is observed in the central layers of the cortex, resembling the stria of Gennari (black arrow). Intensity profiles along a single projection through the cortex (dotted line in zoomed area outlined by yellow box) show that this area is ≈150–250 μm wide (Right Lower). Note the superior CNR of the phase data compared with the magnitude data (all GRE data are displayed at identical noise levels). The observed frequency difference between central GM and WM reaches ≈6.0 Hz. Regions with central darkening in phase show a faint brightening in the MPRAGE image (Left Lower).
Fig. 5.
Fig. 5.
Illustration of possible origins of MRI phase contrast. (Insets) Cortical areas with layer-specific contrast. The increasing contrast seen in the deeper layers of the cortex (a, our data) is consistent with multiple hypothesized origins, including vascular density/hemoglobin content (b; corrosion cast of cortical vasculature reproduced from ref. 38), myelin concentration (c; myelin silver stain reproduced from ref. 39), and iron concentration (d; Perl's iron stain reproduced from ref. 44).

Comment in

  • Phase maps reveal cortical architecture.
    Fischl B, Wald LL. Fischl B, et al. Proc Natl Acad Sci U S A. 2007 Jul 10;104(28):11513-4. doi: 10.1073/pnas.0704515104. Epub 2007 Jul 3. Proc Natl Acad Sci U S A. 2007. PMID: 17609374 Free PMC article. No abstract available.

References

    1. Vaughan JT, Garwood M, Collins CM, Liu W, DelaBarre L, Adriany G, Andersen P, Merkle H, Goebel R, Smith MB, Ugurbil K. Magn Reson Med. 2001;46:24–30. - PubMed
    1. Robitaille PM, Warner R, Jagadeesh J, Abduljalil AM, Kangarlu A, Burgess RE, Yu Y, Yang L, Zhu H, Jiang Z, et al. J Comput Assist Tomogr. 1999;23:808–820. - PubMed
    1. Vaughan T, Delabarre L, Snyder C, Tian J, Akgun C, Shrivastava D, Liu W, Olson C, Adriany G, Strupp J, et al. Magn Reson Med. 2006;56:1274–1282. - PMC - PubMed
    1. de Zwart JA, Ledden PJ, van Gelderen P, Bodurka J, Chu R, Duyn JH. Magn Reson Med. 2004;51:22–26. - PubMed
    1. Wiggins GC, Triantafyllou C, Potthast A, Reykowski A, Nittka M, Wald LL. Magn Reson Med. 2006;56:216–223. - PubMed

LinkOut - more resources