. 2007 Aug;144(4):2009-23.
doi: 10.1104/pp.107.102533. Epub 2007 Jun 22.

Characterization of SSIIIa-deficient mutants of rice: the function of SSIIIa and pleiotropic effects by SSIIIa deficiency in the rice endosperm

Affiliations

Characterization of SSIIIa-deficient mutants of rice: the function of SSIIIa and pleiotropic effects by SSIIIa deficiency in the rice endosperm

Naoko Fujita et al. Plant Physiol. 2007 Aug.

Abstract

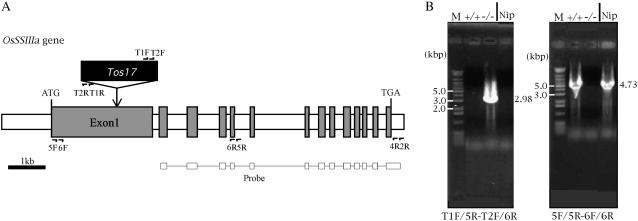
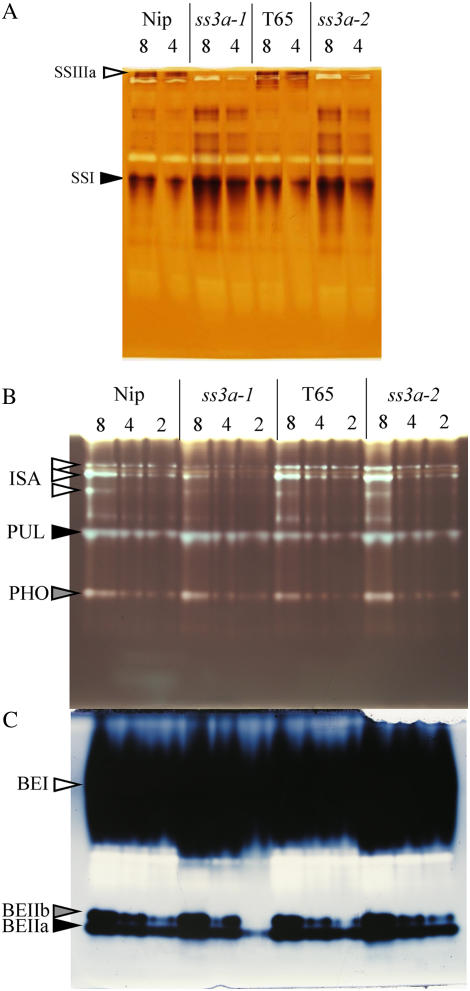
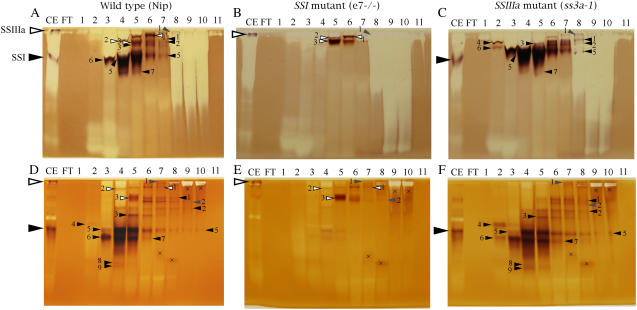
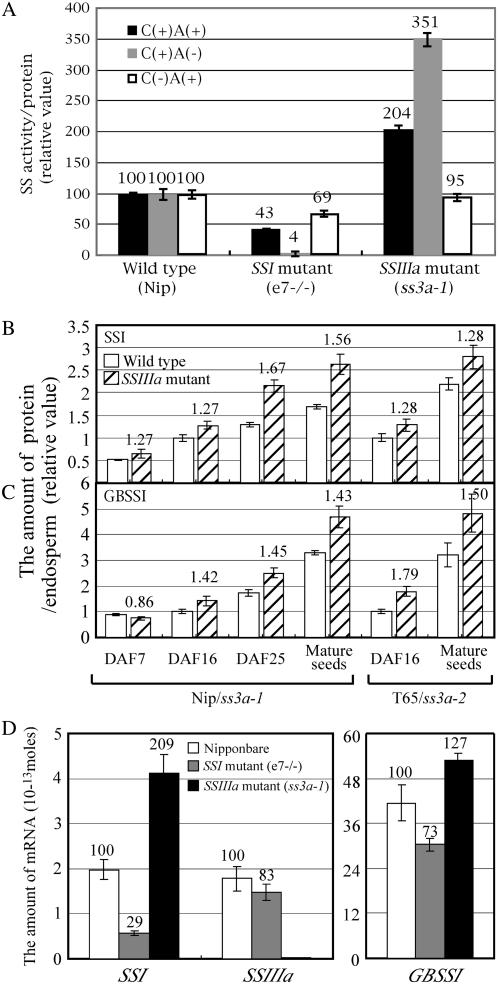
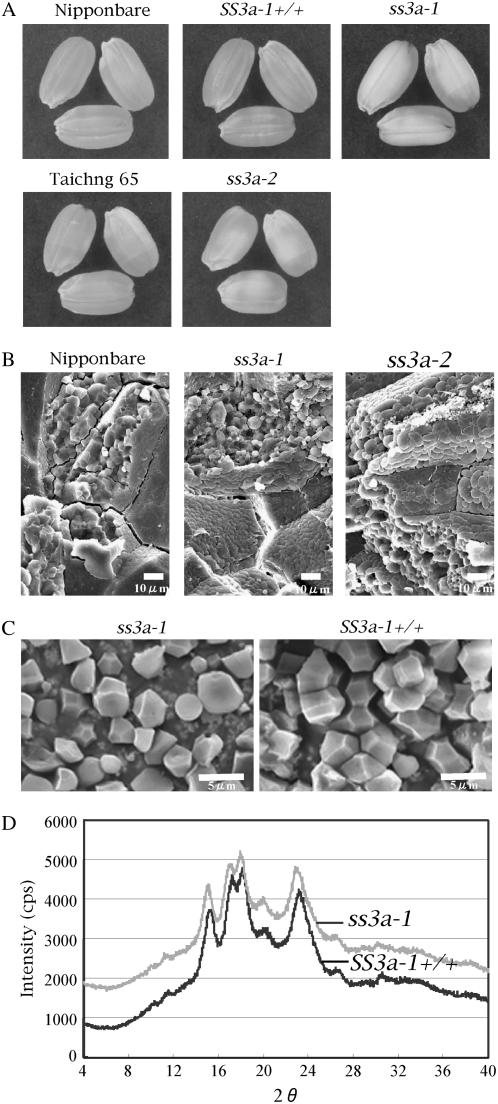
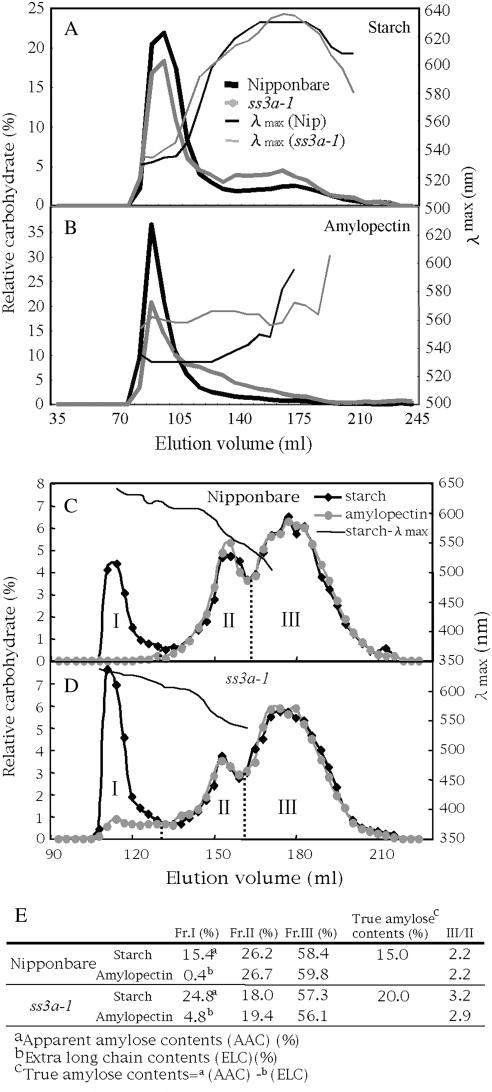
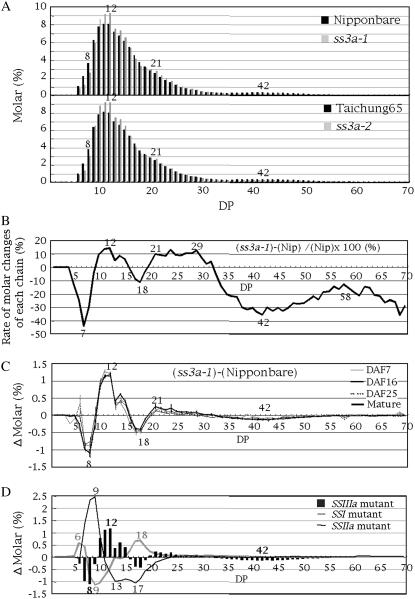
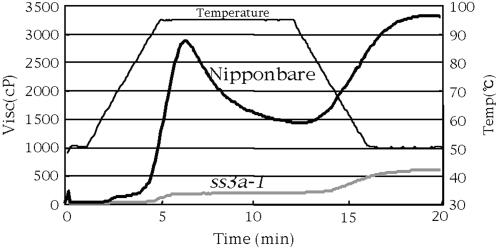
Starch synthase IIIa (SSIIIa)-deficient rice (Oryza sativa) mutants were generated using retrotransposon insertion and chemical mutagenesis. The lowest migrating SS activity bands on glycogen-containing native polyacrylamide gel, which were identified to be those for SSIIIa, were completely absent in these mutants, indicating that they are SSIIIa null mutants. The amylopectin B(2) to B(4) chains with degree of polymerization (DP) >/= 30 and the M(r) of amylopectin in the mutant were reduced to about 60% and 70% of the wild-type values, respectively, suggesting that SSIIIa plays an important part in the elongation of amylopectin B(2) to B(4) chains. Chains with DP 6 to 9 and DP 16 to 19 decreased while chains with DP 10 to 15 and DP 20 to 25 increased in the mutants amylopectin. These changes in the SSIIIa mutants are almost opposite images of those of SSI-deficient rice mutant and were caused by 1.3- to 1.7-fold increase of the amount of SSI in the mutants endosperm. Furthermore, the amylose content and the extralong chains (DP >/= 500) of amylopectin were increased by 1.3- and 12-fold, respectively. These changes in the composition in the mutants starch were caused by 1.4- to 1.7-fold increase in amounts of granules-bound starch synthase (GBSSI). The starch granules of the mutants were smaller with round shape, and were less crystalline. Thus, deficiency in SSIIIa, the second major SS isozyme in developing rice endosperm affected the structure of amylopectin, amylase content, and physicochemical properties of starch granules in two ways: directly by the SSIIIa deficiency itself and indirectly by the enhancement of both SSI and GBSSI gene transcripts.


Figures

Figure 1.
Figure 1.
Site of Tos17 insertion in the OsSSIIIa gene and determination of rice mutant line genotype by PCR. A, Structure of the OsSSIIIa gene. The exons and introns are depicted as gray and white boxes, respectively. ATG and TGA indicate the translation initiation and stop codons, respectively. The insertion site of Tos17 in a mutant line is indicated with a vertical arrow. Horizontal half arrows show the sites of primers for PCR for genotype determination (T1R, T2R, 5F, 6F, 5R, and 6R) and mutant line screening (T1F, T2F, T1R, T2R, 5F, 6F, 2R, 4R, 5R, and 6R). The primers T1F, T2F, T1R, and T2R were designed from the Tos17 sequence, while 5F, 6F, 2R, 4R, 5R, and 6R were designed from the OsSSIIIa gene sequence. The region used as a probe for Southern blotting to screen mutant line is indicated. B, Determination of genotype [homozygous for Tos17 insertion (−/−, left section) or wild homozygous (+/+ right section)] in a mutant line by nested PCR. Primer pairs are indicated below the photographs. T1F/5R-T2F/6R means that the primer pair T1F/5R was used for the first PCR and T2F/6R for the second PCR. M, Molecular markers.
Figure 2.
Figure 2.
Native-PAGE/activity staining of developing endosperm in rice SSIIIa mutant lines and the wild type. The numbers above the lanes are the volumes (μL) of the crude enzyme extract applied onto each lane. A, Native-PAGE/SS activity staining. The SSIIIa and SSI activity bands are indicated by arrowheads. B, Native-PAGE/DBE activity staining. The ISA (isoamylase), PUL (pullulanase), and PHO (phosphorylase) activity bands are indicated by arrowheads. C, Native-PAGE/BE activity staining. The BEI, BEIIa, and BEIIb activity bands are indicated by arrowheads. ‘Nip’, Wild type of ss3a-1, ss3a-1, SSIIIa mutant by Tos17 insertion; ‘T65’, Wild type parent of ss3a-2, ss3a-2, SSIIIa mutant induced by chemical mutagenesis. [See online article for color version of this figure.]
Figure 3.
Figure 3.
Native-PAGE/SS activity staining. SP from 10 g of developing endosperm in the wild type (‘Nip’; A and D), the SSI mutant (e7−/−; B and E), and the SSIIIa mutant (ss3a-1; C and F) was fractionated by anion-exchange chromatography (HiTrapQ). Proteins in the fractions were separated by native-PAGE in gels containing 0.1% rice amylopectin (A, B, and C) or 0.8% oyster glycogen (D, E, and F). Gels were incubated overnight in a SS reaction buffer containing 0.5 m citrate (D, E, and F) or under a citrate-free condition (A, B, and C). The large white and black arrowheads indicate the positions of SSIIIa and SSI in the crude extract (CE), respectively. The small white, black, and gray arrowheads with numbers show that SS activity bands were detected in the ‘Nip’ and SSI mutant, in the ‘Nip’ and SSIIIa mutant, and in all lines, respectively. These activity bands were dependent on the addition of ADP-Glc in the incubation buffer, whereas the bands with X marks are not SS activity bands because they are also detected in the ADP-Glc-free incubation buffer (data not shown). FT, Flow through fraction; numbers 1 to 11, fraction numbers. [See online article for color version of this figure.]
Figure 4.
Figure 4.
A, Total SS activity of the crude extract from developing endosperm in wild type ‘Nip’, the SSI mutant (e7−/−), and the SSIIIa mutant (ss3a-1). The SS activity was assayed in the presence (+) or absence (−) of 0.5 m citrate (C) and exogenous primers (2 mg/mL rice amylopectin; A), as indicated. The numbers on the graph are the percent of the activity in the SSI and SSIIIa mutants under each condition when the activity of ‘Nip’ was defined as 100%. The data are the mean ± se of three seeds. B and C, Amount of SSI (B) or GBSSI (C) protein in developing rice endosperm from DAF 7 through to the mature endosperm of the wild type ‘Nip’ and ‘T65’ and the SSIIIa mutant (ss3a-1 and ss3a-2). The total amount of three fractions (SP, LBP, and TBP; see “Materials and Methods”) of SSI or GBSSI protein was quantified by immunoblotting using antiserum raised against SSI or GBSSI (Fujita et al., 2006). The numbers on the graph are the rate of the amount of protein in SSIIIa mutants to that of the total SSI or GBSSI protein in the wild type. The data are the mean ± se of three seeds. D, Amount of mRNA of SSI, SSIIIa, and GBSSI genes in developing rice endosperm (DAF 10) of the SSI (e7) and SSIIIa (ss3a-1) mutants and the wild type (‘Nip’). The numbers on the graph are the percent of the amount of mRNA in the SSI and SSIIIa mutants when ‘Nip’ was defined as 100%. The data are the mean ± se of three replications.
Figure 5.
Figure 5.
Characterization of the SSIIIa mutant lines ss3a-1 and ss3a-2, control line SS3a-1+/+, and the wild type, ‘Nip’ and ‘T65’. A, Seed morphology. B, SEM of the cross sections of mature endosperm. Bar = 10 μm. C, SEM observations of starch granules. Bar = 5 μm. D, X-ray diffraction patterns of endosperm starch.
Figure 6.
Figure 6.
Size separation of endosperm starch and purified amylopectin from the SSIIIa mutant, ss3a-1, and the wild type, ‘Nip’. A and B, Elution profiles by gel filtration chromatography through Sephacryl S-1000SF of starch (A) and purified amylopectin (B) from ‘Nip’ (black lines) and ss3a-1 (gray lines). C and D, Elution profiles of isoamylase-debranched starch (black lines) and purified amylopectin (gray lines) by gel filtration chromatography through Toyopearl HW55S-HW50S columns from ‘Nip’ (C) and ss3a-1 (D). Each fraction was divided according to the following range of λmax values of the glucan-iodine complex: Fr. I, λmax ≥ 620 nm; Fr. II, 540 nm ≤ λmax < 620 nm; Fr. III, λmax < 540 nm. E, Percentage comparisons of each fraction separated by gel filtration (C and D) in the total carbohydrate of endosperm starch and purified amylopectin from ‘Nip’ and ss3a-1.
Figure 7.
Figure 7.
A, Chain-length distribution patterns of endosperm amylopectin in the mature endosperm of SSIIIa mutant lines (ss3a-1 and ss3a-2) and the wild-type parent ‘Nip’ and ‘T65’. B, Rate of molar changes of each chain relative to the amount of its chain (Δmolar %/molar % × 100), as calculated from A for DP 5 to 60 amylopectin chains of the SSIIIa mutant (ss3a-1). C, Differences in the chain-length distribution patterns of amylopectin in developing endosperm at DAF 7, 16, and 25 and the mature endosperm of the SSIIIa mutant line ss3a-1 and wild-type ‘Nip’. Vertical bars indicate ses. D, Comparison of differences in the chain-length distribution pattern (Δ molar %) among SS mutant lines (SSIIIa, SSI, and SSIIa). Values for the molar % in A and Δ molar % in B, C, and D for each DP are averages of three seeds arbitrarily chosen from a single homozygous plant. The numbers on the plots are the DP values.
Figure 8.
Figure 8.
Pasting properties of endosperm starch of the SSIIIa mutant line ss3a-1 (gray line) and the wild type ‘Nip’ (black line). The viscosity value at each temperature point is the average of three replications. The thin line indicates the change in temperature during measurement with a RVA.

Similar articles

Cited by

References

    1. Abel GJW, Springer F, Willmitzer L, Kossman J (1996) Cloning and functional analysis of a cDNA encoding a novel 139 kDa starch synthase from potato (Solanum tuberosum L.). Plant J 10 981–991 - PubMed
    1. Ball SG, Morell MK (2003) From bacterial glycogen to starch: understanding the biogenesis of the plant starch granule. Annu Rev Plant Biol 54 207–233 - PubMed
    1. Beckles DM, Smith AM, ap Rees T (2001) A cytosolic ADP-glucose pyrophosphorylase is a feature of graminaceous endosperms, but not of other starch-storing organs. Plant Physiol 125 818–827 - PMC - PubMed
    1. Boyer CD, Liu KC (1985) The interaction of endosperm genotype and genetic background. Starch/Stärke 37 73–79
    1. Boyer CD, Preiss J (1981) Evidence for independent genetic control of the multiple forms of maize endosperm branching enzymes and starch synthases. Plant Physiol 67 1141–1145 - PMC - PubMed

Associated data

LinkOut - more resources