

Optical biosensor differentiates signaling of endogenous PAR1 and PAR2 in A431 cells
- PMID: 17587449
- PMCID: PMC1925066
- DOI: 10.1186/1471-2121-8-24
Optical biosensor differentiates signaling of endogenous PAR1 and PAR2 in A431 cells
Abstract
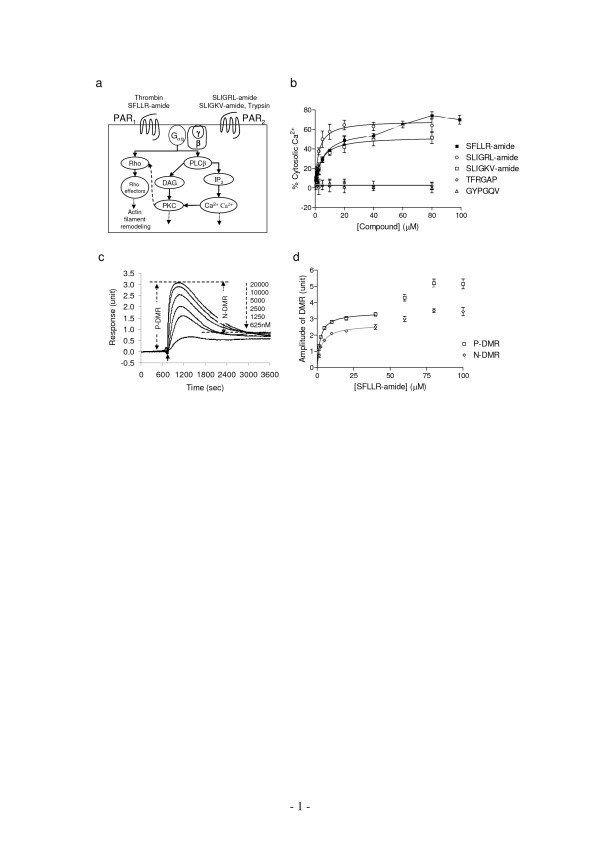
Background: Protease activated receptors (PARs) consist of a family of four G protein-coupled receptors. Many types of cells express several PARs, whose physiological significance is mostly unknown.
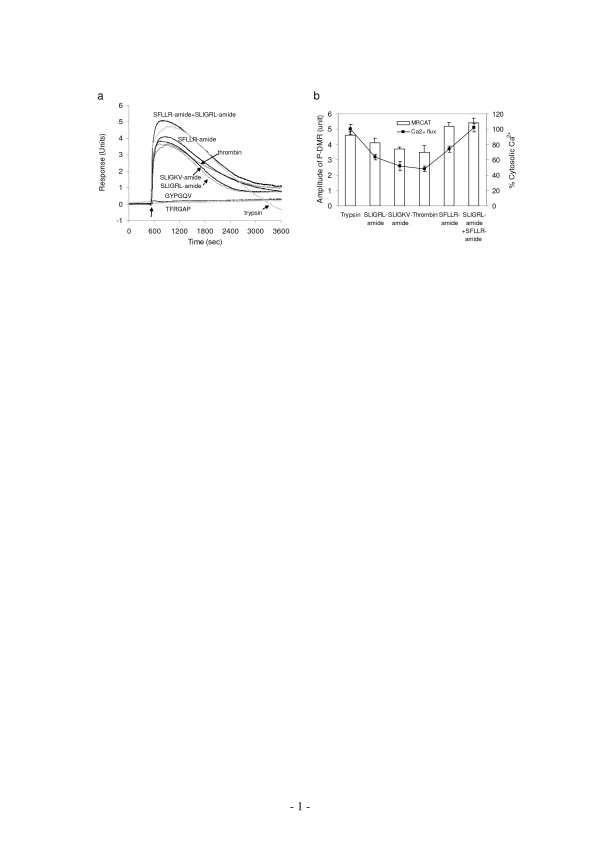
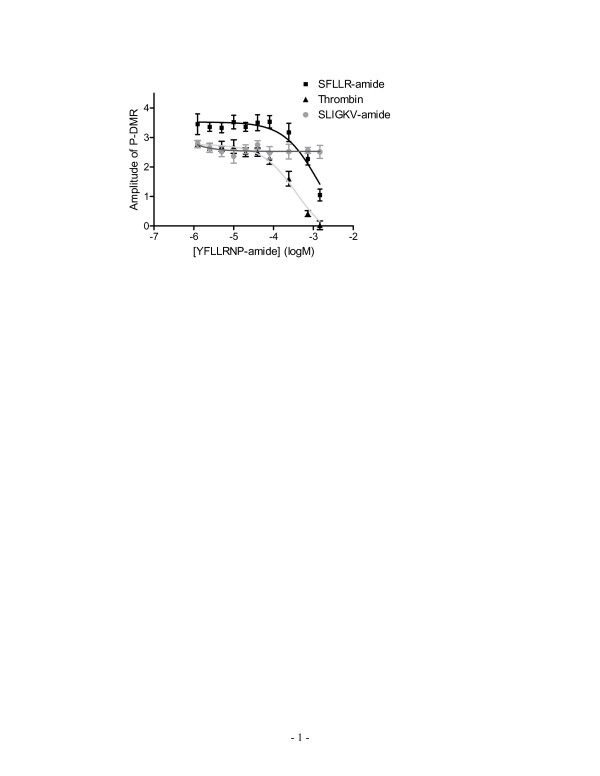
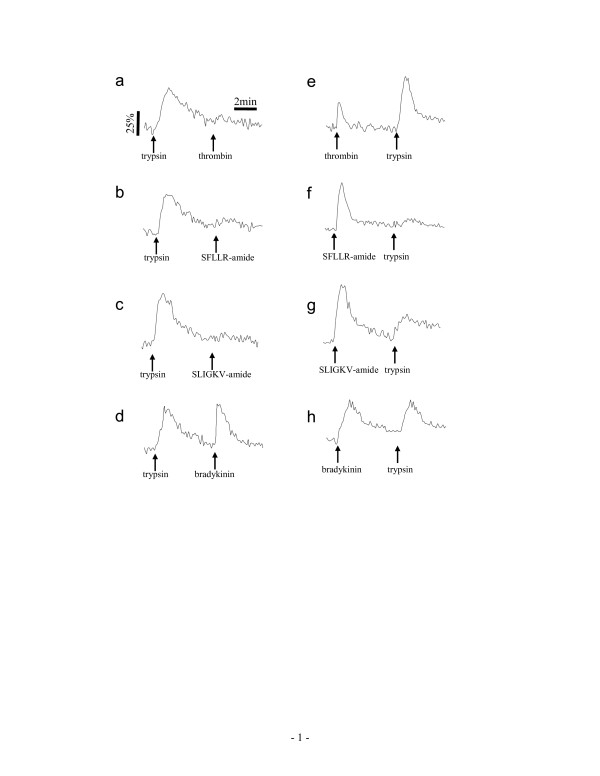
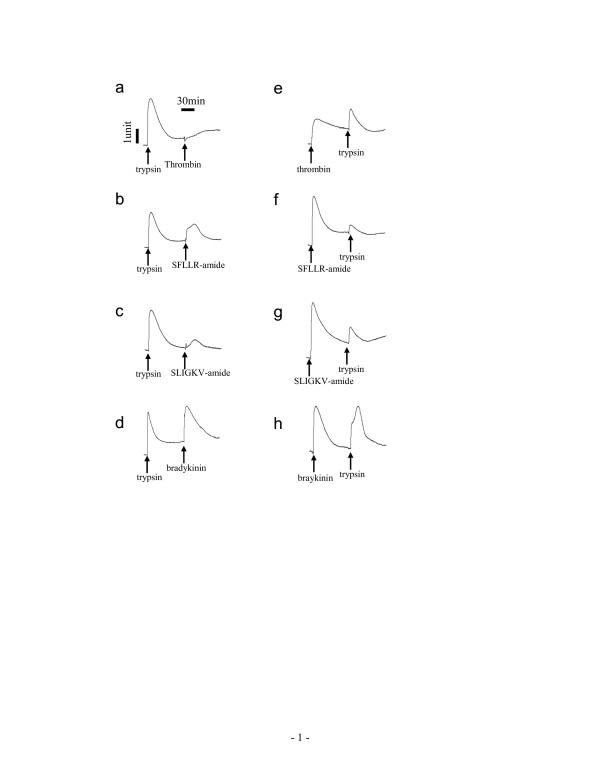
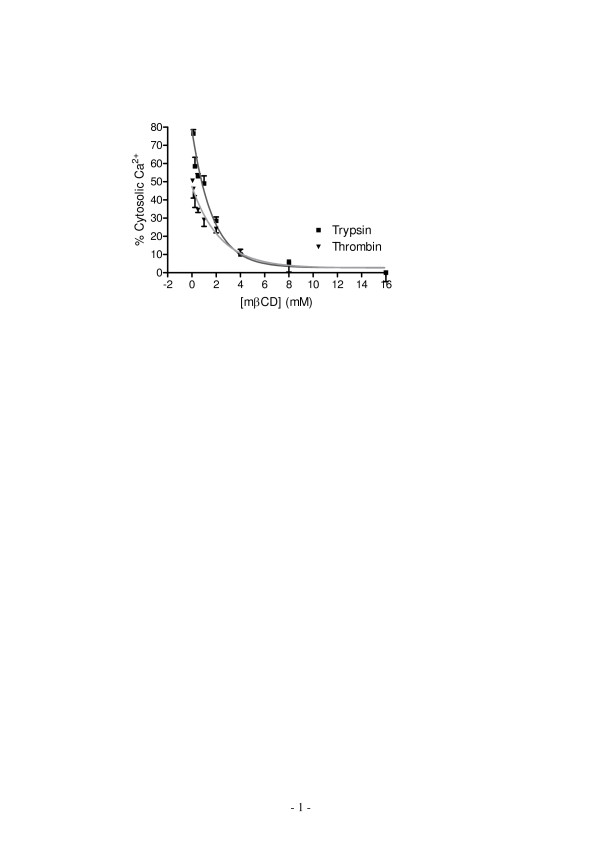
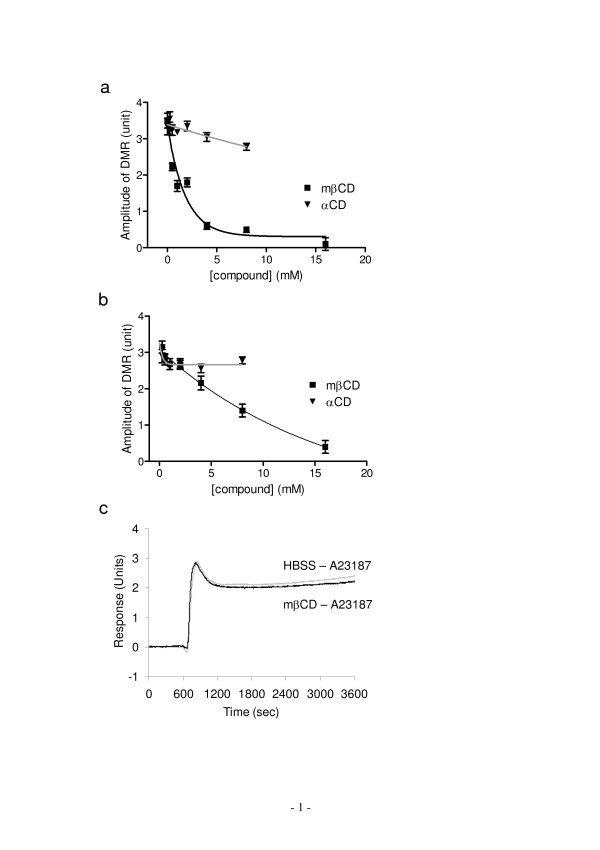
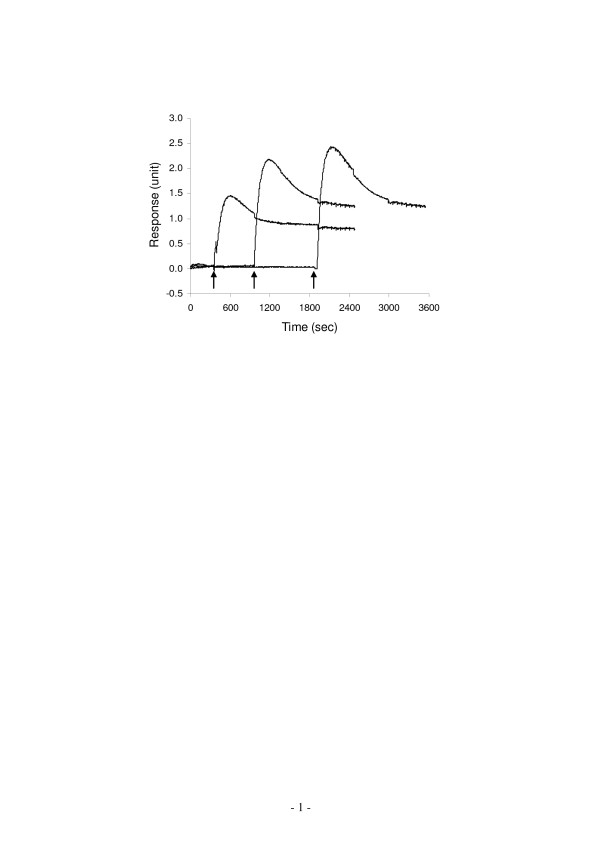
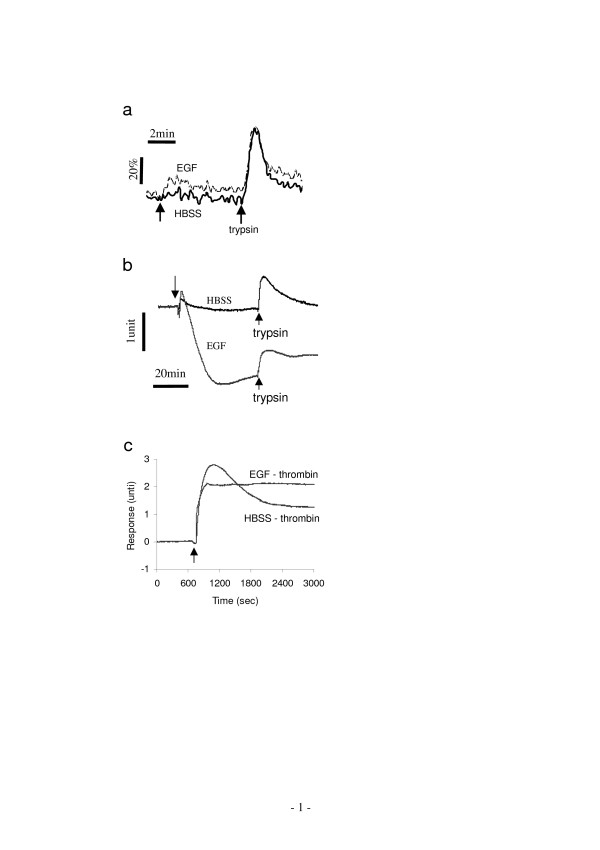
Results: Here, we show that non-invasive resonant waveguide grating (RWG) biosensor differentiates signaling of endogenous protease activated receptor subtype 1 (PAR1) and 2 (PAR2) in human epidermoid carcinoma A431 cells. The biosensor directly measures dynamic mass redistribution (DMR) resulted from ligand-induced receptor activation in adherent cells. In A431, both PAR1 and PAR2 agonists, but neither PAR3 nor PAR4 agonists, trigger dose-dependent Ca2+ mobilization as well as Gq-type DMR signals. Both Ca2+ flux and DMR signals display comparable desensitization patterns upon repeated stimulation with different combinations of agonists. However, PAR1 and PAR2 exhibit distinct kinetics of receptor re-sensitization. Furthermore, both trypsin- and thrombin-induced Ca2+ flux signals show almost identical dependence on cell surface cholesterol level, but their corresponding DMR signals present different sensitivities.
Conclusion: Optical biosensor provides an alternative readout for examining receptor activation under physiologically relevant conditions, and differentiates the signaling of endogenous PAR1 and PAR2 in A431.
Figures
Similar articles
-
Protease-activated receptors (PAR1 and PAR2) contribute to tumor cell motility and metastasis.Mol Cancer Res. 2004 Jul;2(7):395-402. Mol Cancer Res. 2004. PMID: 15280447
-
Protease-activated receptor-2 is essential for factor VIIa and Xa-induced signaling, migration, and invasion of breast cancer cells.Cancer Res. 2006 Jan 1;66(1):307-14. doi: 10.1158/0008-5472.CAN-05-1735. Cancer Res. 2006. PMID: 16397244
-
Protease-activated receptor mediated RhoA signaling and cytoskeletal reorganization in LNCaP cells.Biochemistry. 2003 Jan 28;42(3):702-9. doi: 10.1021/bi027100x. Biochemistry. 2003. PMID: 12534282
-
Microarray studies of factor VIIa-activated cancer cells.Thromb Res. 2008;122 Suppl 1:S11-3. doi: 10.1016/S0049-3848(08)70011-2. Thromb Res. 2008. PMID: 18691491 Review.
-
Proteinase-mediated cell signalling: targeting proteinase-activated receptors (PARs) by kallikreins and more.Biol Chem. 2006 Jun;387(6):677-85. doi: 10.1515/BC.2006.086. Biol Chem. 2006. PMID: 16800728 Review.
Cited by
-
PROBING CANCER SIGNALING WITH RESONANT WAVEGUIDE GRATING BIOSENSORS.Expert Opin Drug Discov. 2010 Dec;5(12):1237-1248. doi: 10.1517/17460441.2010.533652. Expert Opin Drug Discov. 2010. PMID: 21113317 Free PMC article.
-
Recent Advances in Biosensing With Photonic Crystal Surfaces: A Review.IEEE Sens J. 2016 May 15;16(10):3349-3366. doi: 10.1109/JSEN.2015.2429738. Epub 2015 May 5. IEEE Sens J. 2016. PMID: 27642265 Free PMC article.
-
Approaches for probing allosteric interactions at 7 transmembrane spanning receptors.Prog Mol Biol Transl Sci. 2013;115:1-59. doi: 10.1016/B978-0-12-394587-7.00001-4. Prog Mol Biol Transl Sci. 2013. PMID: 23415091 Free PMC article. Review.
-
Intensity interrogation near cutoff resonance for label-free cellular profiling.Sci Rep. 2016 Apr 18;6:24685. doi: 10.1038/srep24685. Sci Rep. 2016. PMID: 27086879 Free PMC article.
-
Monitoring the effects of chemical stimuli on live cells with metasurface-enhanced infrared reflection spectroscopy.Lab Chip. 2021 Oct 12;21(20):3991-4004. doi: 10.1039/d1lc00580d. Lab Chip. 2021. PMID: 34474459 Free PMC article.
References
-
- Negrescu EV, de Quintana KL, Siess W. Platelet shape change induced by thrombin receptor activation. Rapid stimulation of tyrosine phosphorylation of novel protein substrates through an integrin- and Ca2+-independent mechanism. J Biol Chem. 1995;270:1057–1061. doi: 10.1074/jbc.270.3.1057. - DOI - PubMed
MeSH terms
Substances
LinkOut - more resources
Full Text Sources
Other Literature Sources
Miscellaneous
