Comparative Study
. 2007 Jun 22:8:54.
doi: 10.1186/1471-2199-8-54.

Transcriptional response of pancreatic beta cells to metabolic stimulation: large scale identification of immediate-early and secondary response genes

Affiliations
Comparative Study

Transcriptional response of pancreatic beta cells to metabolic stimulation: large scale identification of immediate-early and secondary response genes

Dominique A Glauser et al. BMC Mol Biol. .

Abstract

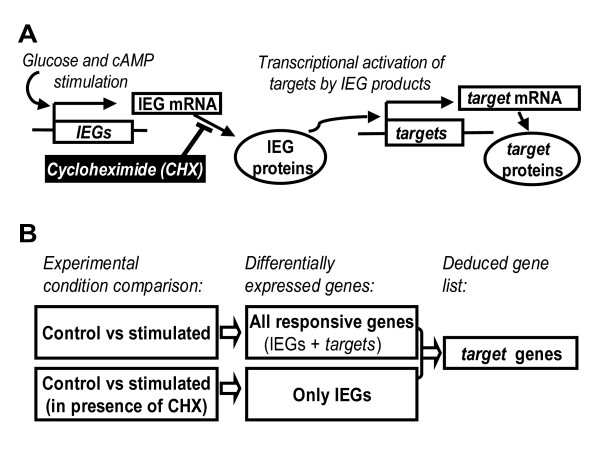
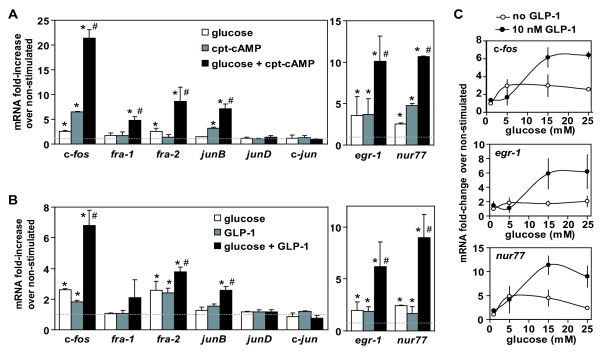
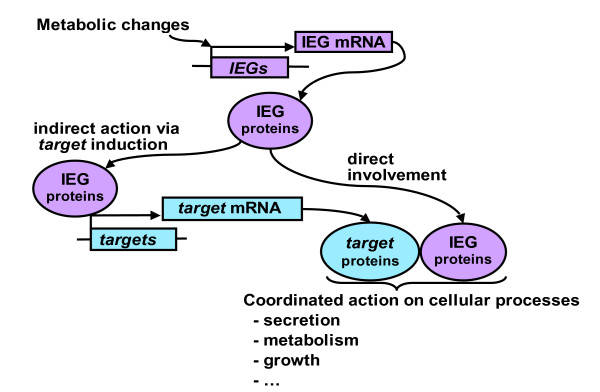
Background: Physiological long term adaptation of pancreatic beta cells is driven by stimuli such as glucose and incretin hormones acting via cAMP (e.g. GLP-1) and involves regulated gene expression. Several rapidly inducible immediate-early genes (IEGs) have been identified in beta cells. Many of these IEGs code for transcription factors and have the potential to control the transcription of downstream target genes likely involved in long term cellular adaptation. The identity of these target genes has not been determined, and the sequence of events occurring during beta cell adaptation is still unclear.

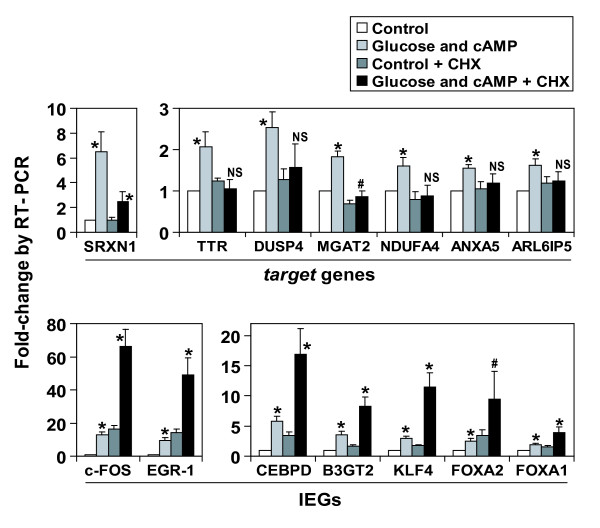
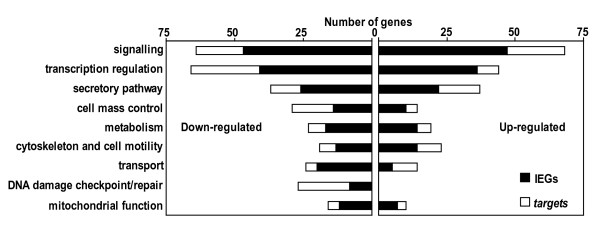
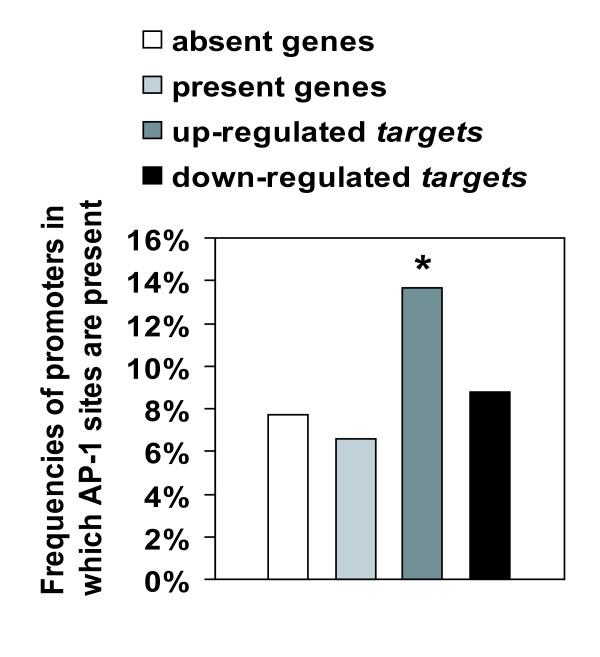
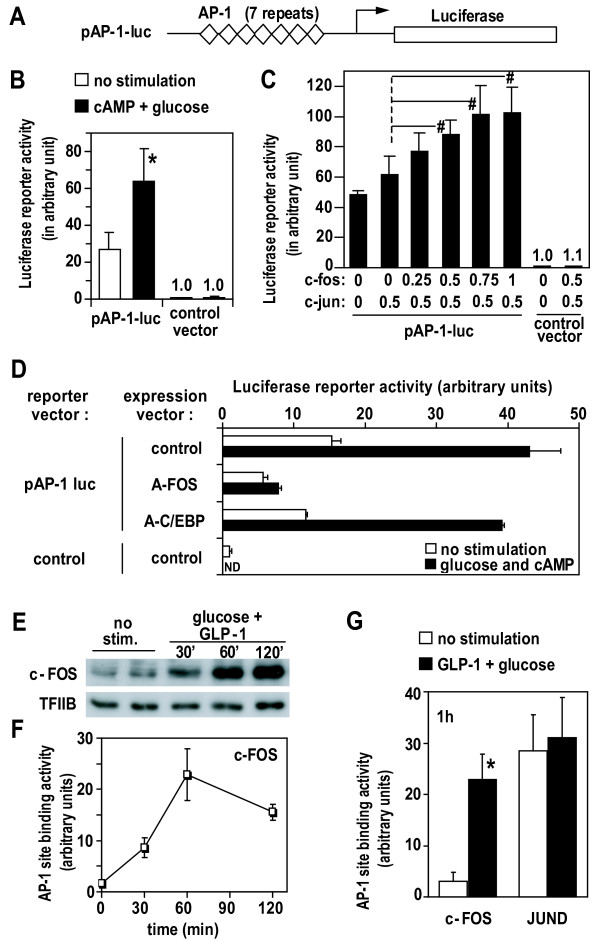
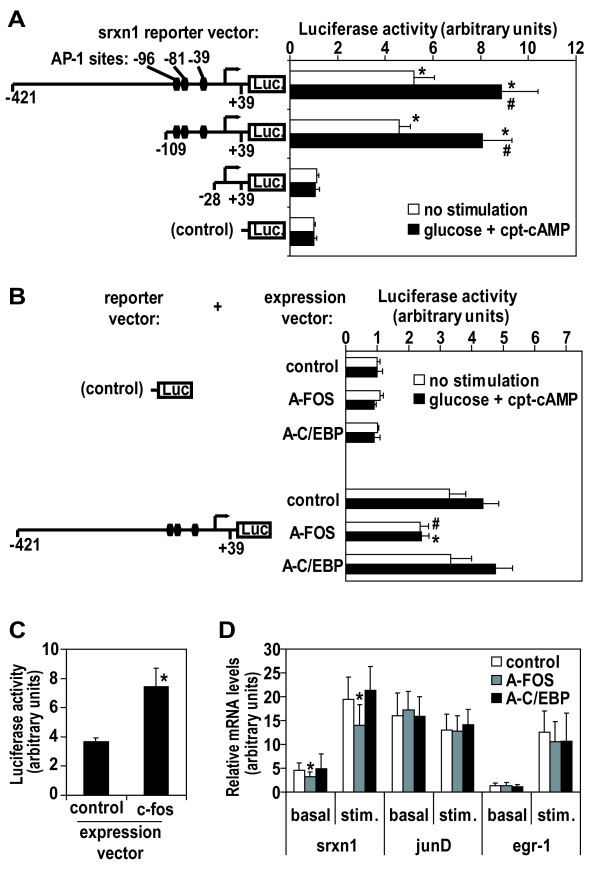
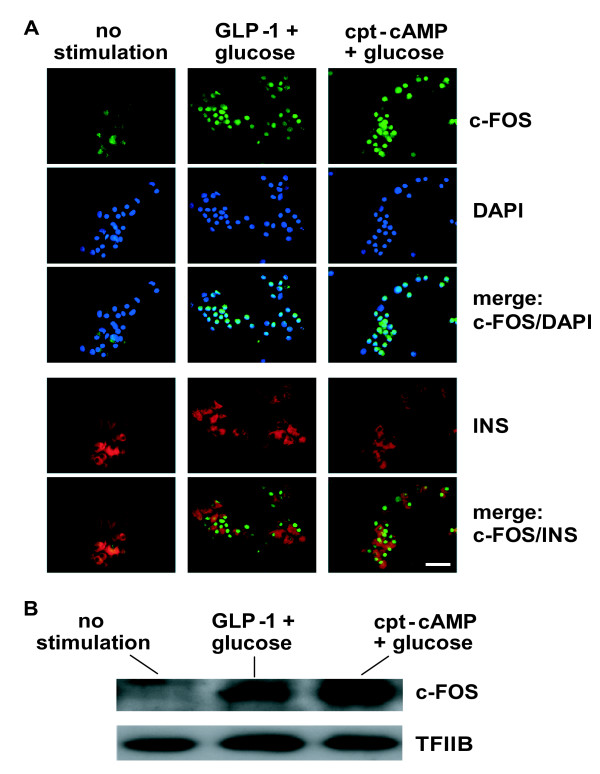
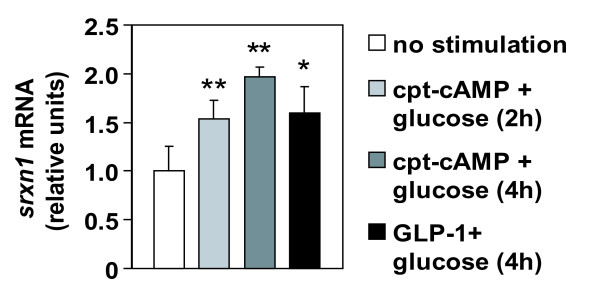
Results: We have developed a microarray-based strategy for the systematic search of targets. In Min6 insulin-secreting cells, we identified 592 targets and 1278 IEGs responding to a co-stimulation with glucose and cAMP. Both IEGs and targets were involved in a large panel of functions, including those important to beta cell physiology (metabolism, secretion). Nearly 200 IEGs were involved in signaling and transcriptional regulation. To find specific examples of the regulatory link between IEGs and targets, target promoter sequences were analyzed in silico. Statistically significant over-representation of AP-1 response elements notably suggested an important role for this transcription factor, which was experimentally verified. Indeed, cell stimulation altered expression of IEG-encoded components of the AP-1 complex, activating AP-1-dependent transcription. Loss and gain-of-function experiments furthermore allowed to validate a new AP-1 regulated gene (sulfiredoxin) among the targets. AP-1 and sulfiredoxin are sequentially induced also in primary cells from rat islets of Langerhans.

Conclusion: By identifying IEGs and their downstream targets, this study brings a comprehensive description of the transcriptional response occurring after beta cell stimulation, as well as new mechanistic insights concerning the AP-1 transcription factor.


Figures

Figure 1
Figure 1
Strategy to identify glucose and cAMP responsive IEGs and their downstream targets. A) IEGs (immediate-early genes) are genes which are transcriptionaly inducible in a protein synthesis independent manner. IEG products regulate in turn the transcription of downstream targets. Cycloheximide (CHX), a protein synthesis inhibitor, blocks IEG product synthesis and subsequent activation of target transcription. B) Genes induced by glucose and cAMP comprise both IEGs and targets. Genes induced by glucose and cAMP in presence of CHX represent only IEGs. Note that CHX is also present in the control condition for this comparison. Target genes were deduced by subtraction between the gene lists.
Figure 2
Figure 2
Validation of IEGs and targets by quantitative RT-PCR. Induction of targets is inhibited in presence of CHX, while induction of IEGs is not. Min6 cells cultured at low glucose for 20 hours were stimulated for 4 hours with 10 mM glucose and 0.2 mM cpt-cAMP, in presence or absence of CHX (5 μg/ml, added 45' prior to stimulation). mRNA levels for indicated genes were assessed by quantitative real-time RT-PCR and normalized with 18S rRNA. Results are expressed as mean of fold change compared to control condition (s.d. as error bars, n = 5). *, p < 0.01; #, p < 0.05; NS: non significant vs respective control condition (i.e with or without CHX), by Student T-test.
Figure 3
Figure 3
Functional clustering of glucose and cAMP responsive IEGs and targets. From the list of glucose and cAMP regulated transcripts, we retrieved 755 genes with annotations in Swiss-Prot database and clustered them according to functional categories. The diagram depicts the predominant clusters (gathering 534 genes); the 221 remaining genes were found in smaller clusters and are not represented.
Figure 4
Figure 4
AP-1 binding sites are over-represented in promoters of up-regulated targets. Frequencies of promoters containing at least one AP-1 binding site were determined using TFExplorer predicted regulatory element database. Among the genes displayed on the microarray, absent genes were those with undetectable expression in Min6 and present genes were those with detectable expression in Min6. *, p < 0.01 by Fisher exact test vs present genes.
Figure 5
Figure 5
Glucose and cAMP regulate transcriptional activation by AP-1 through induction of AP-1 component expression. A) Schematic representation of pAP-1-luc reporter. B) Min6 cells were transfected with pAP-1-luc (or control vector) and maintained at low glucose before stimulation with glucose (10 mM) and cpt-cAMP (0.2 mM) for 6 hours. C) Cells were transfected with AP-1 reporter (or control vector) and indicated quantity (in μg) of expression vector for c-fos and c-jun. D) pAP-1 reporter vector was co-transfected with either A-FOS (a c-FOS dominant negative form), empty vector (control) or A-C/EBP as additional control (dominant negative form of C/EBP, a transcription factor structurally related to c-FOS). Stimulations were performed as under B. E,F,G) Min6 cells cultured at low glucose were stimulated with high glucose (10 mM) and GLP-1 (10 nM) for indicated period of time. Nuclear extracts were analyzed by western (E). Specific binding of c-FOS and JUND to AP-1 sequence was measured in nuclear extracts with an ELISA-like assay (F,G). E, F) representative of two repeated experiments. #, p < 0.05 vs c-Jun alone (n = 3); *, p < 0.01 (n = 4), by Student T-test. Error bars: s.d.; ND: not determined.
Figure 6
Figure 6
Srxn1 is a transcriptional target of AP-1. A) Depicted srxn1 reporter constructs were transfected in Min6 cells. Results as means of four independent experiments, with s.d. as error bars. *, p < 0.01 vs control; #, p < 0.01 vs corresponding non-stimulated condition, by Student T-test. B) Depicted srxn1 reporter constructs were co-transfected respectively with A-FOS, A-C/EBP, or a control expression vector. Results as means of four independent experiments, with s.d. as error bars. *, #, p < 0.01, respectively p < 0.05 vs control expression vector, by Student T-test. For A) and B), stimulations were performed with 0.2 mM cpt-cAMP and 10 mM glucose for 6 hours. C) srxn1-421/+39pGL3 reporter was cotransfected with c-fos expression vector (as in Figure 5). Results as means of four independent experiments, with s.d. as error bars. *, p < 0.01 vs control expression vector, by Student T-test. D) mRNA levels for srxn1, junD and egr-1 were quantified by RT-PCR in Min6 clones stably transfected with A-FOS, control expression vector and A-C/EBP respectively. Stimulations were performed with 0.2 mM cpt-cAMP and 10 mM glucose for four hours. Four different cell preparations were analyzed for each of at least three clones in each category. Results were pooled and expressed as mean of relative mRNA levels (arbitrary units) with s.d. as error bars. *, p < 0.001 vs control, by Student T-test.
Figure 7
Figure 7
Induction of IEGs by metabolic stimuli in isolated rat islets. Rat islets were isolated, cultured and serum deprived at reduced glucose concentration (1 mM) for 20 hours. Stimulation was done for one hour with 0.2 mM cpt-cAMP and/or 25 mM glucose (A); or with 10 nM GLP-1 and/or 25 mM glucose (B). mRNA levels for mentioned genes were quantified in triplicate by real-time RT-PCR, normalized with reference to 18S rRNA, and are shown as fold-increase over non-stimulated controls. Shown are the means of values obtained for three (A) or two (B) independent experiments (error bars = s.d.). Student T-tests were used for statistical analysis; *p < 0.05 vs non-stimulated; # p < 0.05 vs single stimulus conditions. C) Effect of various glucose concentrations on the induction level of IEG expression (after one hour stimulation). Results as mean of at least two independent experiments (s.d. as error bars).
Figure 8
Figure 8
Accumulation of c-FOS protein in the nuclei of primary beta cells upon metabolic stimulations. A) Islets were isolated, trypsin digested, cultured and serum deprived at low glucose concentration (1 mM) for 20 hours. After 60 minutes of co-stimulation with 10 nM GLP-1 and 15 mM glucose or 0.2 mM cpt-cAMP and 15 mM glucose, islets (50–100 per condition) were fixed and analyzed by immunofluorescence staining of c-FOS (green) and of insulin (INS, red); nuclei were stained with the DNA reactive DAPI dye (violet). Fluorescence images shown separately for each dye or merged (c-FOS/DAPI; c-FOS/INS) are representative of three different experiments. Bar: 50 μm. B) Islets were isolated, maintained and serum deprived at low glucose concentration (1 mM) for 20 hours, prior to co-stimulation with 10 nM GLP-1 and 15 mM glucose or 0.2 mM cpt-cAMP and 15 mM glucose. After 90 minutes of stimulation, islets (~800 per condition) were trypsin digested, nuclear extracts were prepared and c-FOS expression analyzed by western blotting. TFIIB was used as loading control.
Figure 9
Figure 9
Induction of srxn1 expression by metabolic stimuli in isolated rat islets. Rat islets were isolated, cultured, and serum deprived at reduced glucose concentration (1 mM) for 20 hours. Stimulation was done for indicated period of time with high glucose (25 mM) plus cpt-cAMP (0.2 mM) or GLP-1 (10 nM). Transcript levels of the AP-1 target gene srxn1 were quantified by real-time RT-PCR, normalized with reference to 18S rRNA, and shown as relative values. Shown are the means of values obtained for at least three experiments. Student T-tests were used for statistical analysis; *p < 0.05 vs non-stimulated; ** p < 0.01 vs non-stimulated.
Figure 10
Figure 10
Cellular adaptation to physiologically relevant stimuli occurring via a combination of direct and indirect modes of transcriptional control. IEG products have two modes of action in the cellular adaptation to metabolic signals. Some IEG products act indirectly by controlling transcription of target genes. Other IEG products are involved directly in regulated cellular processes. A coherent adaptation of these processes requires the combined action of both IEG and target gene products.

Similar articles

Cited by

References

    1. Drucker DJ. Glucagon-like peptides: regulators of cell proliferation, differentiation, and apoptosis. Mol Endocrinol. 2003;17:161–171. doi: 10.1210/me.2002-0306. - DOI - PubMed
    1. Hinke SA, Hellemans K, Schuit FC. Plasticity of the beta cell insulin secretory competence: preparing the pancreatic beta cell for the next meal. J Physiol. 2004;558:369–380. doi: 10.1113/jphysiol.2004.064881. - DOI - PMC - PubMed
    1. Schuit F, Flamez D, De Vos A, Pipeleers D. Glucose-regulated gene expression maintaining the glucose-responsive state of beta-cells. Diabetes. 2002;51 Suppl 3:S326–32. doi: 10.2337/diabetes.51.2007.S326. - DOI - PubMed
    1. Bouwens L, Rooman I. Regulation of pancreatic beta-cell mass. Physiol Rev. 2005;85:1255–1270. doi: 10.1152/physrev.00025.2004. - DOI - PubMed
    1. Jonas JC, Sharma A, Hasenkamp W, Ilkova H, Patane G, Laybutt R, Bonner-Weir S, Weir GC. Chronic hyperglycemia triggers loss of pancreatic beta cell differentiation in an animal model of diabetes. J Biol Chem. 1999;274:14112–14121. doi: 10.1074/jbc.274.20.14112. - DOI - PubMed

Publication types