

'MRI-negative PET-positive' temporal lobe epilepsy (TLE) and mesial TLE differ with quantitative MRI and PET: a case control study
- PMID: 17588263
- PMCID: PMC1929122
- DOI: 10.1186/1471-2377-7-16
'MRI-negative PET-positive' temporal lobe epilepsy (TLE) and mesial TLE differ with quantitative MRI and PET: a case control study
Abstract
Background: 'MRI negative PET positive temporal lobe epilepsy' represents a substantial minority of temporal lobe epilepsy (TLE). Clinicopathological and qualitative imaging differences from mesial temporal lobe epilepsy are reported. We aimed to compare TLE with hippocampal sclerosis (HS+ve) and non lesional TLE without HS (HS-ve) on MRI, with respect to quantitative FDG-PET and MRI measures.
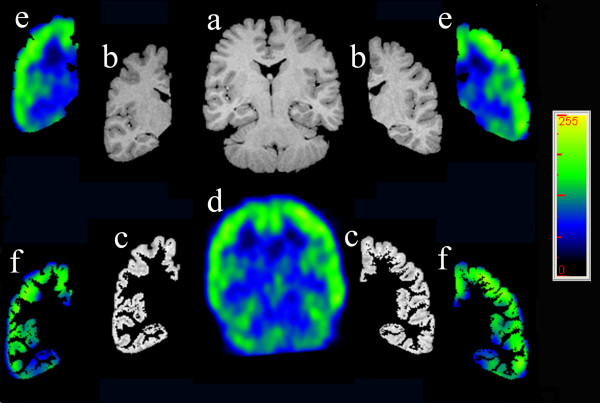
Methods: 30 consecutive HS-ve patients with well-lateralised EEG were compared with 30 age- and sex-matched HS+ve patients with well-lateralised EEG. Cerebral, cortical lobar and hippocampal volumetric and co-registered FDG-PET metabolic analyses were performed.
Results: There was no difference in whole brain, cerebral or cerebral cortical volumes. Both groups showed marginally smaller cerebral volumes ipsilateral to epileptogenic side (HS-ve 0.99, p = 0.02, HS+ve 0.98, p < 0.001). In HS+ve, the ratio of epileptogenic cerebrum to whole brain volume was less (p = 0.02); the ratio of epileptogenic cerebral cortex to whole brain in the HS+ve group approached significance (p = 0.06). Relative volume deficits were seen in HS+ve in insular and temporal lobes. Both groups showed marked ipsilateral hypometabolism (p < 0.001), most marked in temporal cortex. Mean hypointensity was more marked in epileptogenic-to-contralateral hippocampus in HS+ve (ratio: 0.86 vs 0.95, p < 0.001). The mean FDG-PET ratio of ipsilateral to contralateral cerebral cortex however was low in both groups (ratio: HS-ve 0.97, p < 0.0001; HS+ve 0.98, p = 0.003), and more marked in HS-ve across all lobes except insula.
Conclusion: Overall, HS+ve patients showed more hippocampal, but also marginally more ipsilateral cerebral and cerebrocortical atrophy, greater ipsilateral hippocampal hypometabolism but similar ipsilateral cerebral cortical hypometabolism, confirming structural and functional differences between these groups.
Figures


Similar articles
-
MRI-negative PET-positive temporal lobe epilepsy: a distinct surgically remediable syndrome.Brain. 2004 Oct;127(Pt 10):2276-85. doi: 10.1093/brain/awh257. Epub 2004 Jul 28. Brain. 2004. PMID: 15282217
-
"Magnetic resonance imaging negative positron emission tomography positive" temporal lobe epilepsy: FDG-PET pattern differs from mesial temporal lobe epilepsy.Mol Imaging Biol. 2007 Jan-Feb;9(1):32-42. doi: 10.1007/s11307-006-0073-0. Mol Imaging Biol. 2007. PMID: 17176980
-
Neocortical temporal FDG-PET hypometabolism correlates with temporal lobe atrophy in hippocampal sclerosis associated with microscopic cortical dysplasia.Epilepsia. 2003 Apr;44(4):559-64. doi: 10.1046/j.1528-1157.2003.36202.x. Epilepsia. 2003. PMID: 12681005
-
Hippocampal sclerosis--origins and imaging.Epilepsia. 2012 Sep;53 Suppl 4:19-33. doi: 10.1111/j.1528-1167.2012.03610.x. Epilepsia. 2012. PMID: 22946718 Review.
-
When should a resection sparing mesial structures be considered for temporal lobe epilepsy?Epilepsy Behav. 2008 Jul;13(1):7-11. doi: 10.1016/j.yebeh.2008.02.015. Epub 2008 Mar 24. Epilepsy Behav. 2008. PMID: 18359666 Review.
Cited by
-
Growing applications of FDG PET-CT imaging in non-oncologic conditions.J Biomed Res. 2015 May;29(3):189-202. doi: 10.7555/JBR.29.20140081. Epub 2015 Mar 8. J Biomed Res. 2015. PMID: 26060443 Free PMC article.
-
Network Analysis on Predicting Mean Diffusivity Change at Group Level in Temporal Lobe Epilepsy.Brain Connect. 2016 Oct;6(8):607-620. doi: 10.1089/brain.2015.0381. Epub 2016 Sep 7. Brain Connect. 2016. PMID: 27405726 Free PMC article.
-
Prospective Quantitative Neuroimaging Analysis of Putative Temporal Lobe Epilepsy.Front Neurol. 2021 Nov 5;12:747580. doi: 10.3389/fneur.2021.747580. eCollection 2021. Front Neurol. 2021. PMID: 34803885 Free PMC article.
-
Classification and lateralization of temporal lobe epilepsies with and without hippocampal atrophy based on whole-brain automatic MRI segmentation.PLoS One. 2012;7(4):e33096. doi: 10.1371/journal.pone.0033096. Epub 2012 Apr 16. PLoS One. 2012. PMID: 22523539 Free PMC article.
-
Comments on hippocampal sclerosis in children younger than 2 years.Pediatr Radiol. 2011 Oct;41(10):1229-31. doi: 10.1007/s00247-011-2168-2. Epub 2011 Jul 22. Pediatr Radiol. 2011. PMID: 21779893 No abstract available.
References
Publication types
MeSH terms
Substances
LinkOut - more resources
Full Text Sources
Medical
