. 2007 Jul;35(7):1015-25.
doi: 10.1016/j.exphem.2007.03.014.

MicroRNA expression dynamics during murine and human erythroid differentiation

Affiliations

MicroRNA expression dynamics during murine and human erythroid differentiation

Mei Zhan et al. Exp Hematol. 2007 Jul.

Abstract

Objective: MicroRNAs (miRNAs) are an abundant class of small noncoding RNAs that regulate diverse cellular functions by sequence-specific inhibition of gene expression. We determined miRNA expression profile during erythroid differentiation and putative roles in erythroid differentiation.

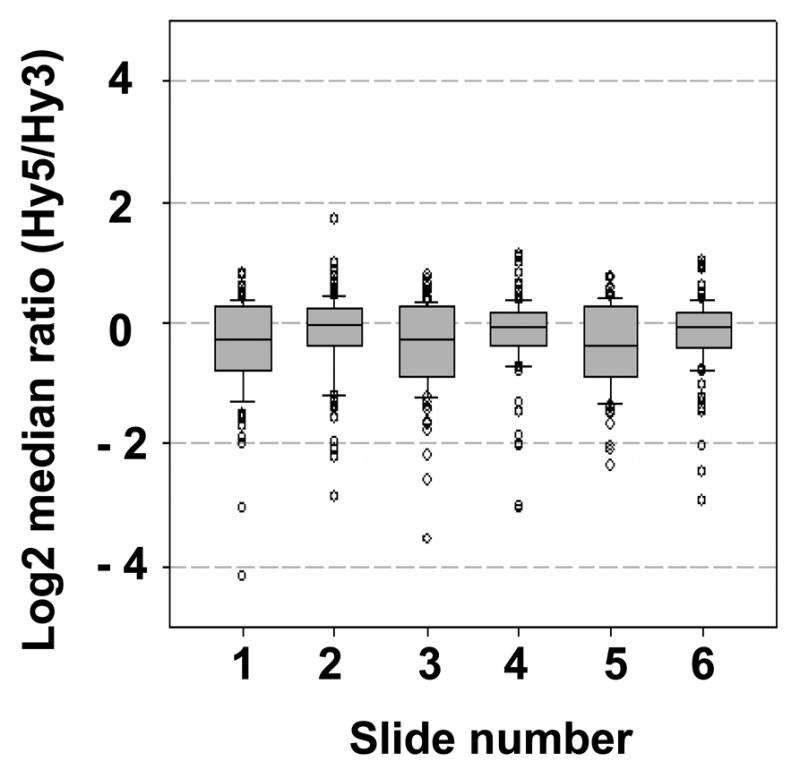
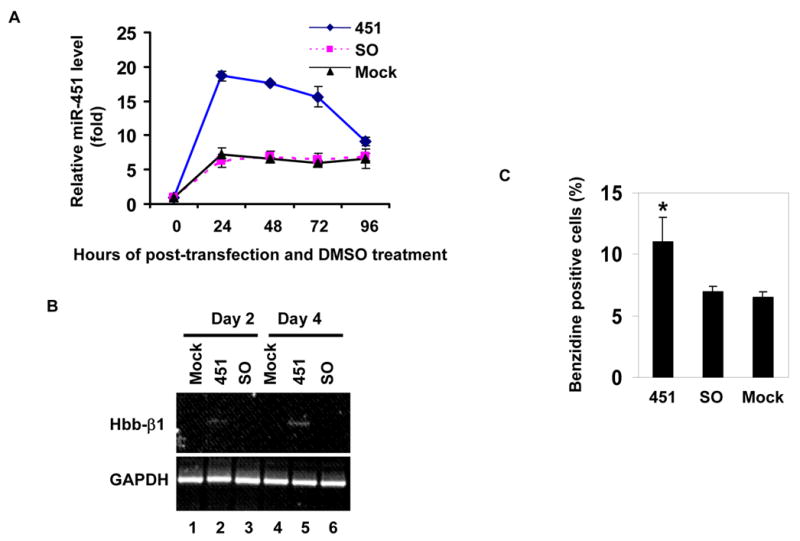
Methods: The expression profile of 295 miRNAs before and after their erythroid differentiation induction was analyzed using microarray. Fluorescein-activated cell sorting analysis was used to isolate mouse spleen erythroblasts at different differentiation stages. Human cord blood CD34+ progenitors were differentiated in vitro. Real-time reverse transcriptase polymerase chain reaction was used to confirm the results of miRNA microarray. Synthetic oligonucleotides for miR-451 overexpression or knockdown were transfected into MEL cells.

Results: More than 100 miRNAs were found to be expressed in erythroid cells. The majority of them showed changes in their expression levels with progression of erythroid differentiation. Further analysis revealed that overall miRNA expression levels are increased upon erythroid differentiation. Of the miRNAs analyzed, miR-451 was most significantly upregulated during erythroid maturation. Functional studies using gain of function and loss of function approaches showed that miR-451 is associated with erythroid maturation.

Conclusions: Dynamic changes in miRNA expression occurred during erythroid differentiation, with an overall increase in the levels of miRNAs upon terminal differentiation of erythroid cells. MiR-451 may play a role in promoting erythroid differentiation.


Figures

Figure 1
Figure 1
Dynamic changes in miRNA expression during erythroid differentiation. (A) Total RNAs were purified from MEL cells with or without DMSO treatment for 96 hours. MicroRNA profiling was carried out using miRCURY LNA array. Three independent arrays were performed under each treatment condition. Relative hybridization signals for microRNAs in MEL cells with and without induction of erythroid differentiation by DMSO are shown (mean ± SD). (B) Overall increase in miRNA expression level during erythroid differentiation. Box plot shows the distribution of hybridization signals in all capture probes on each array. RNAs from each sample (Hy5) and common reference pool (Hy3) are labeled using the miRCURY Hy3/Hy5 labelling kit and hybridized on the miRCURY LNA Array (v.8.0). Capture probes with a Log2 median ratio of “0” on the Y-axis correspond to miRNAs that are equally expressed in MEL cells with or without DMSO induction of erythroid differentiation. Slide 1, 3 and 5 are data from untreated MEL cells. Slide 2, 4 and 6 are data from MEL cells that are treated with DMSO for 96 hours. The lower boundary of the box indicates the 25th percentile, the line within the box shows the median, and the upper edge of the box marks the 75th percentile. Whiskers above and below each box indicate the 95th and 5th percentiles. All data points that lie outside the 5th and 95th percentiles are shown as symbols. This analysis revealed that there is an overall up-regulation of miRNA expression during erythroid differentiation.
Figure 1
Figure 1
Dynamic changes in miRNA expression during erythroid differentiation. (A) Total RNAs were purified from MEL cells with or without DMSO treatment for 96 hours. MicroRNA profiling was carried out using miRCURY LNA array. Three independent arrays were performed under each treatment condition. Relative hybridization signals for microRNAs in MEL cells with and without induction of erythroid differentiation by DMSO are shown (mean ± SD). (B) Overall increase in miRNA expression level during erythroid differentiation. Box plot shows the distribution of hybridization signals in all capture probes on each array. RNAs from each sample (Hy5) and common reference pool (Hy3) are labeled using the miRCURY Hy3/Hy5 labelling kit and hybridized on the miRCURY LNA Array (v.8.0). Capture probes with a Log2 median ratio of “0” on the Y-axis correspond to miRNAs that are equally expressed in MEL cells with or without DMSO induction of erythroid differentiation. Slide 1, 3 and 5 are data from untreated MEL cells. Slide 2, 4 and 6 are data from MEL cells that are treated with DMSO for 96 hours. The lower boundary of the box indicates the 25th percentile, the line within the box shows the median, and the upper edge of the box marks the 75th percentile. Whiskers above and below each box indicate the 95th and 5th percentiles. All data points that lie outside the 5th and 95th percentiles are shown as symbols. This analysis revealed that there is an overall up-regulation of miRNA expression during erythroid differentiation.
Figure 2
Figure 2
Validation of microarray data using real-time RT-PCR. The levels of miR-15b, miR-16, miR-22, miR-26a, miR-29a and miR-451 are significantly up-regulated upon erythroid differentiation using microarray analysis. Real-time RT-PCR analysis of these miRNAs using total RNAs isolated from MEL cells without and with DMSO treatment as described for the microarray assays was carried out to validate the array results. Total RNAs from three independent cultures under each treatment condition are used for the analysis. Triplicate assays were performed from each RNA sample. Data are normalized using U6 small nuclear RNA as an endogenous control for RNA input. Fold changes for these miRNAs following DMSO treatment from array and real-time RT-PCR are shown as mean ± SD.
Figure 3
Figure 3
Expression of selected miRNAs in murine erythroblasts at different stages of erythroid differentiation. (A) flow cytometry density plot of spleen cells from PHZ treated mice. Spleen cells were immunostained with PE–conjugated anti-TER119 and FITC–conjugated anti-CD71 antibodies. X and y axes indicate the fluorescence units for PE and FITC respectively. Selected regions are proerythroblasts (P4), basophilic erythroblasts (P5), late basophilic and polychromatophilic erythroblasts (P6), and orthochromatic erythroblasts (P7). (B) Real-time RT-PCR assay of miR-15b, miR-16, miR-22, miR-26a, miR-29a and miR-451 levels in each erythroblast cell population as depicted. Data are shown in logarithmic scale as fold changes in miRNA levels relative to proerythroblasts (P4), which is set as 1 (mean ± SD).
Figure 4
Figure 4
Up-regulation of miR-451 during erythroid differentiation in E cultures of human CB CD34+ progenitors. (A) Cells in E culture were incubated with a PE-conjugated anti-glycophorin A antibody. Erythroblast differentiation and maturation were analyzed by FACS. X-axis indicates relative fluorescence units for PE. Y-axis indicates the relative cell size. (B) MiR-451 levels were measured using Real-time RT-PCR at day 0, 4 and 8 of E culture. The percentage of Glycophorin A + cells in E culture at day 4 and day 8 was analyzed using FACS (as shown in A).
Figure 5
Figure 5
Overexpression of miR-451 induced erythroid differentiation of MEL cells. (A) miR-451 levels increased following DMSO induction of erythroid differentiation. miR-451 level was further elevated following transfection of miR-451 oligonucleotides. MEL cells were treated with DMSO and transfected with miR-451 oligonucleotides (451), scrambled oligonucleotides (SO) as control or mock transfected as indicated. Total RNA was prepared at different time points as indicated after transfection and DMSO treatment. miR-451 levels were analyzed using real-time RT-PCR. Assays were carried out in triplicate for each RNA sample. Data are normalized using U6 small nuclear RNA as an endogenous control for RNA input. Fold changes in miR-451 levels are shown as mean ± SD. (B) MEL cells were transfected as in (A) without DMSO treatment. β globin expression was analyzed using RT-PCR at day 2 and 4 following transfection. GAPDH was used as a control for RNA input. (C) Hemoglobinization was analyzed by benzidine staining 48 hours after transfection and DMSO treatment as in (A). *, p < 0.05 compared with SO and mock transfection controls.
Figure 6
Figure 6
Inhibition of miR-451 using miR-451 antisense oligonucleotides (ASO) blocks erythroid differentiation of MEL cells. (A) Dose-dependent decrease in miR-451 levels by miR-451 ASO (ASO). MEL cells were treated with DMSO and transfected with different amounts of miR-451 ASO or SO oligonucleotides as indicated for 48 hours. MiR-451 levels were analyzed using real-time RT-PCR. (B) Time course of miR-451 inhibition by ASO. MEL cells were treated with DMSO and transfected with 50 nM of ASO or SO control oligonucleotides as indicated. The levels of miR-451 were analyzed using real-time RT-PCR at different time points as depicted. (C) Inhibition of endogenous miR-451 blocks DMSO-induced β globin expression. MEL cells were treated with DMSO and transfected with ASO, SO oligonucleotides or mock transfected as indicated. β-globin levels were analyzed using RT-PCR at day 2 and day 4 post-transfection and induction as indicated. GAPDH was used as control for RNA input. (D) Inhibition of endogenous miR-451 blocks DMSO-induced hemoglobinization. Hemoglobinization was analyzed using benzidine staining on day 0, day 2 and day 4 following transfection as in C. *, p < 0.05 compared with SO and mock transfection controls.

References

    1. Ambros V. The functions of animal microRNAs. Nature. 2004;431:350–355. - PubMed
    1. Alvarez-Garcia I, Miska EA. MicroRNA functions in animal development and human disease. Development. 2005;132:4653–4662. - PubMed
    1. Bartel DP. MicroRNAs: genomics, biogenesis, mechanism, and function. Cell. 2004;116:281–297. - PubMed
    1. Sontheimer EJ, Carthew RW. Silence from within: endogenous siRNAs and miRNAs. Cell. 2005;122:9–12. - PubMed
    1. Filipowicz W, Jaskiewicz L, Kolb FA, Pillai RS. Post-transcriptional gene silencing by siRNAs and miRNAs. Curr Opin Struct Biol. 2005;15:331–341. - PubMed

Publication types