Detection of trabecular bone microdamage by micro-computed tomography
- PMID: 17588588
- PMCID: PMC2098869
- DOI: 10.1016/j.jbiomech.2007.05.009
Detection of trabecular bone microdamage by micro-computed tomography
Abstract
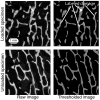
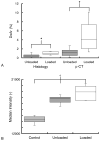
Microdamage is an important component of bone quality and affects bone remodeling. Improved techniques to assess microdamage without the need for histological sectioning would provide insight into the role of microdamage in trabecular bone strength by allowing the spatial distribution of damage within the trabecular microstructure to be measured. Nineteen cylindrical trabecular bone specimens were prepared and assigned to two groups. The specimens in group I were damaged to 3% compressive strain and labeled with BaSO(4). Group II was not loaded, but was labeled with BaSO(4). Micro-computed tomography (Micro-CT) images of the specimens were obtained at 10 microm resolution. The median intensity of the treated bone tissue was compared between groups. Thresholding was also used to measure the damaged area fraction in the micro-CT scans. The histologically measured damaged area fraction, the median CT intensity, and the micro-CT measured damaged area fraction were all higher in the loaded group than in the unloaded group, indicating that the micro-CT images could differentiate the damaged specimen group from the unloaded specimens. The histologically measured damaged area fraction was positively correlated with the micro-CT measured damaged area fraction and with the median CT intensity of the bone, indicating that the micro-CT images can detect microdamage in trabecular bone with sufficient accuracy to differentiate damage levels between samples. This technique provides a means to non-invasively assess the three-dimensional distribution of microdamage within trabecular bone test specimens and could be used to gain insight into the role of trabecular architecture in microdamage formation.
Conflict of interest statement
Conflict of Interest Statement
None of the authors have financial or personal interests with organizations that may benefit from this work.
Figures


References
-
- Arthur Moore TL, Gibson LJ. Microdamage accumulation in bovine trabecular bone in uniaxial compression. Journal of Biomechanical Engineering. 2002;124:63–71. - PubMed
-
- Burr DB, Martin RB, Schaffler MB, Radin EL. Bone remodeling in response to in vivo fatigue microdamage. Journal of Biomechanics. 1985;18:189–200. - PubMed
-
- Burr DB, Stafford T. Validity of the bulk-staining technique to separate artifactual from in vivo bone microdamage. Clin Orthop. 1990:305–308. - PubMed
-
- Fazzalari NL, Forwood MR, Manthey BA, Smith K, Kolesik P. Three-dimensional confocal images of microdamage in cancellous bone. Bone. 1998;23:373–378. - PubMed
-
- Fazzalari NL, Kuliwaba JS, Forwood MR. Cancellous bone microdamage in the proximal femur: Influence of age and osteoarthritis on damage morphology and regional distribution. Bone. 2002;31:697–702. - PubMed

