. 2007 Jun;3(6):e87.
doi: 10.1371/journal.ppat.0030087.

Transcriptional regulation of multi-drug tolerance and antibiotic-induced responses by the histone-like protein Lsr2 in M. tuberculosis

Affiliations

Transcriptional regulation of multi-drug tolerance and antibiotic-induced responses by the histone-like protein Lsr2 in M. tuberculosis

Roberto Colangeli et al. PLoS Pathog. 2007 Jun.

Abstract

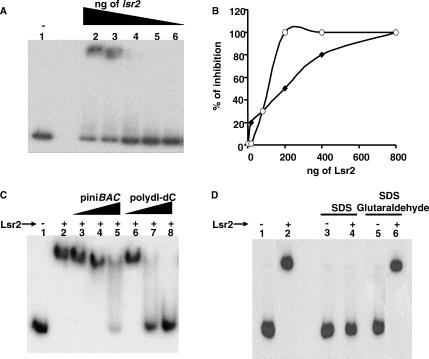
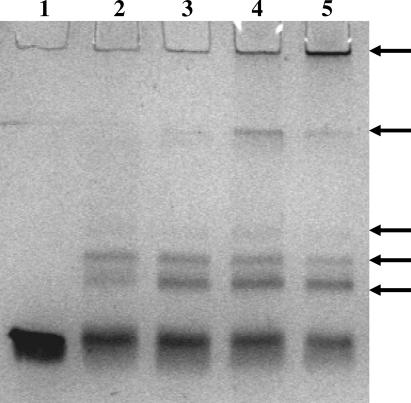
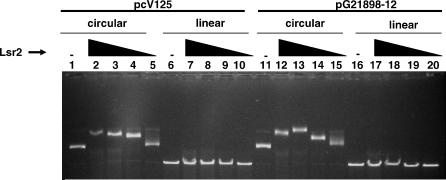
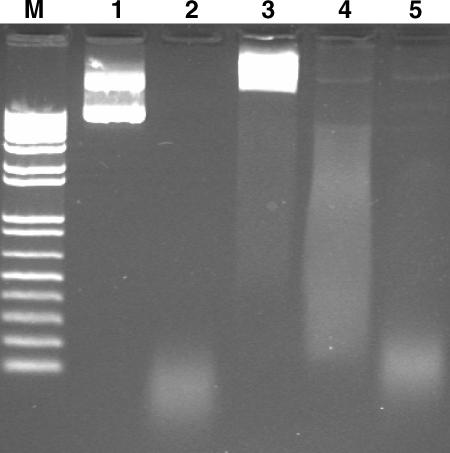
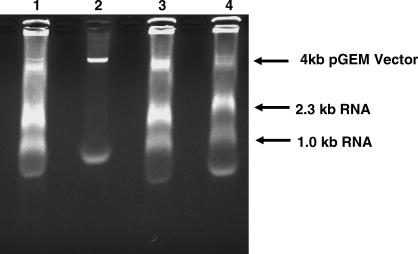
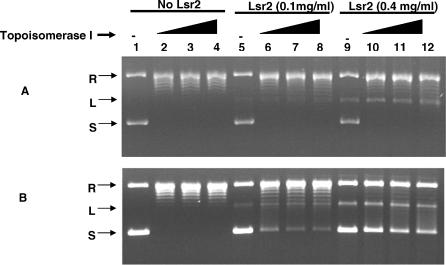
Multi-drug tolerance is a key phenotypic property that complicates the sterilization of mammals infected with Mycobacterium tuberculosis. Previous studies have established that iniBAC, an operon that confers multi-drug tolerance to M. bovis BCG through an associated pump-like activity, is induced by the antibiotics isoniazid (INH) and ethambutol (EMB). An improved understanding of the functional role of antibiotic-induced genes and the regulation of drug tolerance may be gained by studying the factors that regulate antibiotic-mediated gene expression. An M. smegmatis strain containing a lacZ gene fused to the promoter of M. tuberculosis iniBAC (PiniBAC) was subjected to transposon mutagenesis. Mutants with constitutive expression and increased EMB-mediated induction of PiniBAC::lacZ mapped to the lsr2 gene (MSMEG6065), a small basic protein of unknown function that is highly conserved among mycobacteria. These mutants had a marked change in colony morphology and generated a new polar lipid. Complementation with multi-copy M. tuberculosis lsr2 (Rv3597c) returned PiniBAC expression to baseline, reversed the observed morphological and lipid changes, and repressed PiniBAC induction by EMB to below that of the control M. smegmatis strain. Microarray analysis of an lsr2 knockout confirmed upregulation of M. smegmatis iniA and demonstrated upregulation of genes involved in cell wall and metabolic functions. Fully 121 of 584 genes induced by EMB treatment in wild-type M. smegmatis were upregulated ("hyperinduced") to even higher levels by EMB in the M. smegmatis lsr2 knockout. The most highly upregulated genes and gene clusters had adenine-thymine (AT)-rich 5-prime untranslated regions. In M. tuberculosis, overexpression of lsr2 repressed INH-mediated induction of all three iniBAC genes, as well as another annotated pump, efpA. The low molecular weight and basic properties of Lsr2 (pI 10.69) suggested that it was a histone-like protein, although it did not exhibit sequence homology with other proteins in this class. Consistent with other histone-like proteins, Lsr2 bound DNA with a preference for circular DNA, forming large oligomers, inhibited DNase I activity, and introduced a modest degree of supercoiling into relaxed plasmids. Lsr2 also inhibited in vitro transcription and topoisomerase I activity. Lsr2 represents a novel class of histone-like proteins that inhibit a wide variety of DNA-interacting enzymes. Lsr2 appears to regulate several important pathways in mycobacteria by preferentially binding to AT-rich sequences, including genes induced by antibiotics and those associated with inducible multi-drug tolerance. An improved understanding of the role of lsr2 may provide important insights into the mechanisms of action of antibiotics and the way that mycobacteria adapt to stresses such as antibiotic treatment.


Conflict of interest statement

Competing interests. The authors have declared that no competing interests exist.

Figures

Figure 1
Figure 1. Morphology and β-Lactamase Activity of the lsr2::Tn5370 Mutant in M. smegmatis
(A) Magnification of individual colonies. Left, wild-type NJS20.w (control); center, NJS20.1 (lsr2 transposon mutant); right, NJS20.1c (complemented lsr2 transposon mutant). (B) Overall morphology and color of the two strains. Left, NJS20.w; right, NJS20.1
Figure 2
Figure 2. Effect of lsr2 Gene Inactivation and Overexpression on Activity of the M. tuberculosis iniBAC Promoter
The activity of the PiniBAC in the presence or absence of 5 ug/ml EMB is indicated by β-galactosidase units. (A) “Uninduced” cultures without EMB treatment. (B) “Induced” cultures treated with EMB. Open columns, β-galactosidase activity of an NJS20.w control containing a random transposon insertion; dashed columns, the lsr2 transposon mutant strain NJS20.1; closed columns, the complemented mutant NJS20.1c. The mean and standard deviations of at least triplicate experiments of each strain are shown. Note that different scales were used for β-lactamase units in (A) and (B).
Figure 3
Figure 3. Effect of lsr2 Inactivation and Overexpression on Antibiotic Susceptibility in M. smegmatis
(A and B) Antibiotic susceptibility is calculated by examining the proportion of colonies surviving on plates containing (A) EMB or (B) ciprofloxacin (CIP) compared to plates without antibiotics. , the Mc2155 NJS20 control; ▪, the NJS20.1 lsr2 transposon mutant; , the NJS20.1c complemented strain. The mean and standard deviations of at least triplicate cultures of each strain are shown.
Figure 4
Figure 4. Whole M. smegmatis Genome Microarray Analysis
(A) Venn diagram showing statistically significantly upregulated genes in each of the three experimental comparisons. Comparison 1, expression of NJS20 compared to that of the Δlsr2 strain NJS22; comparison 2, expression of NJS20 compared to that of NJS20 cultured in EMB; comparison 3, expression of NJS20 compared to that of NJS22 (both cultured in EMB). (B) Expression levels of all genes in the M. smegmatis chromosome in comparison 1. Each dot corresponds to a single open reading frame. (C) Magnification of two sections within the M. smegmatis genome (*, region 1; **, region 2 in [B]) that contain clusters of upregulated genes. All genes are represented by arrows; red arrows correspond to genes that are significantly upregulated in condition 1, black arrows correspond to genes that are not significantly upregulated in condition 1.
Figure 5
Figure 5. Effect of lsr2 Overexpression on Expression of the iniBAC Operon, inhA, kasA, and efpA in M. tuberculosis
The mRNA levels for wild-type M. tuberculosis H37Rv or of the M. tuberculosis lsr2 overexpression strain NJT18 are shown with and without 24 h incubation in INH at a final concentration of 1.0 ug/ml. The mRNA levels are expressed as values that have been normalized to 16S mRNA levels in the same sample. Solid columns, H37Rv incubated in media without INH; dashed columns, H37Rv incubated with INH; open columns, NJT18 incubated in media without INH; gray columns, NJT18 incubated with INH. The mean and standard deviations of at least triplicate experiments and triplicate cultures of each strain and condition are shown.
Figure 6
Figure 6. Two-Dimensional TLC Analysis of the Polar Lipids Extracted from M. smegmatis Strains
(A) Two-dimensional TLC of polar lipid fractions from wild-type M. smegmatis Mc2155, lsr2 transposon mutant NJS20.1, and complemented strain NJS20.1c. The solvent system is as follows: first dimension, chloroform/methanol/water (60/30/6); second dimension, chloroform/acetic acid/methanol/water (40/25/3/6). The spots were visualized with orcinol. The black arrow marks the spot present in the NJS20.1 mutant and not in either the control or the complemented strain. (B) The cells were grown to log phase and labeled with [1-14C]-acetate. The black arrow indicates the new lipid.
Figure 7
Figure 7. DNA Binding Properties of Lsr2
(A) EMSA assay of radiolabeled PiniBAC in the presence of Lsr2. Five fmole (0.7 ng) of PiniBAC were incubated with the following amounts of Lsr2: lane 1, 0 ng; lane 2, 400 ng; lane 3, 200 ng; lane 4, 100 ng; lane 5, 50 ng; lane 6, 25 ng. (B) Determination of the Kd of Lsr2-binding activity to PiniBAC. Five fmole (♦) and 50 fmole (○) of radiolabeled PiniBAC were incubated with the following amounts of Lsr2: 0 ng, 50 ng, 100 ng, 200 ng, 400 ng, and 800 ng; and then analyzed in EMSA assays. (C) Competition analysis. Fifty fmole of radiolabeled PiniBAC were incubated with 200 ng of Lsr2 where indicated. Different amounts of either cold PiniBAC or poly dI-dC were then added as competitors. Lane 1, no Lsr2 (all other lanes contain Lsr2); lane 2, no competitor; lane 3, 7 ng of PiniBAC; lane 4, 37 ng of PiniBAC; lane 5, 72 ng of PiniBAC; lane 6, 7 ng of poly dI-dC; lane 7, 37 ng of poly dI-dC; lane 8, 72 ng of poly dI-dC. (D) Specificity of DNA binding. Five fmole of radiolabeled PiniBAC were incubated with 200 ng of Lsr2 where indicated by a “+” followed by treatment with 0.5% SDS or SDS plus 0.1% glutaraldehyde where indicated. Lane 1, radiolabeled PiniBAC only; lane 2, Lsr2 added; lane 3, SDS only; lane 4, Lsr2 plus SDS; lane 5, SDS plus glutaraldehyde only; lane, 6 Lsr2 plus SDS and glutaraldehyde.
Figure 8
Figure 8. Progressive Lsr2 Oligomerization in the Presence of DNA
Lsr2 (1 μg) was incubated with 0.5 μg of PiniBAC DNA in the presence of 0.1% of glutaraldehyde. Aliquots were analyzed at different time points on a Coomassie blue–stained SDS polyacrylamide gel. Lane 1, Lsr2 alone (control); lane 2, 1 min; lane 3, 2 min; lane 4, 5 min; lane 5, 10 min. Arrows indicate the location of the principal oligomer bands.
Figure 9
Figure 9. Preferential Binding of Lsr2 to Circular DNA: Agarose Gel Shift of Linearized versus Circular DNA
Four hundred nanograms of either linear or circular pCV125 or pG21898–12 (pCV125 containing the PiniBAC sequence) were analyzed in the presence of different amounts of Lsr2 (600 ng of Lsr2 in lanes 2, 7, 12, and 17; 400 ng in lanes 3, 8, 13, and 18; 200 ng in lanes 4, 9, 14, and 19; and 100 ng in lanes 5, 10, 15, and 20). No Lsr2 was added to the control lanes 1, 6, 11, and 16. After 120 min of incubation at room temperature, the samples were analyzed on a 1% agarose gel.
Figure 10
Figure 10. DNase I Protection Studies
The ΦhX174 plasmid was incubated with Lsr2 where indicated and then treated with different concentrations of DNase I. Samples (except for lane 3) were treated with 6% SDS and 4 mg/ml protease K for 30 min at 37 °C before analysis on a 1% agarose gel. Lane 1, ΦhX174 alone; lane 2, ΦhX174 treated with 0.02 unit of DNase I; lane 3, ΦhX174 incubated with Lsr2 without DNase I treatment; lane 4, ΦhX174 incubated with Lsr2 followed by treatment with 0.02 unit of DNase I; lane 5, ΦhX174 incubated with Lsr2 followed by treatment with 1 unit of DNase I. M, DNA molecular marker.
Figure 11
Figure 11. Effect of Lsr2 on In Vitro Transcription
The pGEM plasmid was pre-incubated with different concentrations of Lsr2 where indicated. In vitro transcription was then performed either in transcription buffer or in buffer plus added imidazole (the Lsr2 elution) at the appropriate control concentration. Lane 1, pGEM with 200 ng of Lsr2; lane 2, pGEM with 600 ng of Lsr2; lane 3, pGEM with 40 nM imidazole (control for lane 1); lane 4, pGEM with 120 nM imidazole (control for lane 2).
Figure 12
Figure 12. Effect of Lsr2 on Topoisomerase I Activity
Different amounts of topoisomerase I were added to 200 ng of supercoiled ΦX174 RT DNA. Lanes 1, 5, and 9, no topoisomerase; lanes 2, 6, and 10, 2.4 units of topoisomerase; lanes 3, 7, and 11, 6 units of topoisomerase; lanes 4, 8, and 12, 12 units of topoisomerase. Lsr2 at 0.1 mg/ml or 0.4 mg/ml was added to the reaction either simultaneously with the topoisomerase or after 30 min incubation with topoisomerase alone. The reaction was then treated with 6% SDS and 4 mg/ml proteinase K analyzed on a 0.7% agarose gel and then stained with ethidium bromide. (A) Topoisomerase I and Lsr2 were incubated simultaneously with ΦX174. (B) Lsr2 was added 30 min after the topoisomerase incubation. L, linearized plasmid; R, relaxed plasmid; S, supercoiled plasmid.

References

    1. Wilson M, DeRisi J, Kristensen HH, Imboden P, Rane S, et al. Exploring drug-induced alterations in gene expression in Mycobacterium tuberculosis by microarray hybridization. Proc Natl Acad Sci U S A. 1999;96:12833–12838. - PMC - PubMed
    1. Alland D, Kramnik I, Weisbrod TR, Otsubo L, Cerny R, et al. Identification of differentially expressed mRNA in prokaryotic organisms by customized amplification libraries (DECAL): The effect of isoniazid on gene expression in Mycobacterium tuberculosis . Proc Natl Acad Sci U S A. 1998;95:13227–13232. - PMC - PubMed
    1. Colangeli R, Helb D, Sridharan S, Sun J, Varma-Basil M, et al. The Mycobacterium tuberculosis iniA gene is essential for activity of an efflux pump that confers drug tolerance to both isoniazid and ethambutol. Mol Microbiol. 2005;55:1829–1840. - PubMed
    1. Balaban NQ, Merrin J, Chait R, Kowalik L, Leibler S. Bacterial persistence as a phenotypic switch. Science. 2004;305:1622–1625. - PubMed
    1. Moyed HS, Bertrand KP. hipA, a newly recognized gene of Escherichia coli K-12 that affects frequency of persistence after inhibition of murein synthesis. J Bacteriol. 1983;155:768–775. - PMC - PubMed

Publication types

MeSH terms