. 2007 Jul 9;204(7):1543-51.
doi: 10.1084/jem.20070109. Epub 2007 Jun 25.

CREB/ATF-dependent T cell receptor-induced FoxP3 gene expression: a role for DNA methylation

Affiliations

CREB/ATF-dependent T cell receptor-induced FoxP3 gene expression: a role for DNA methylation

Hyoung-Pyo Kim et al. J Exp Med. .

Abstract

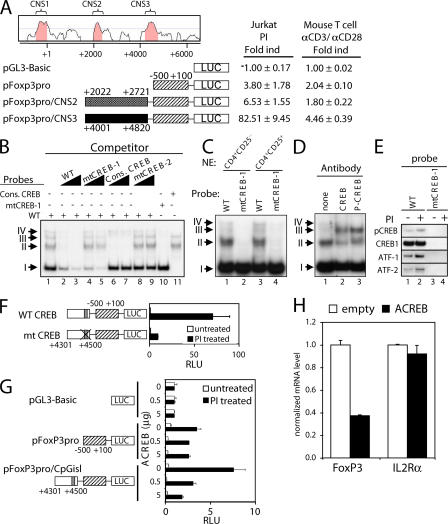
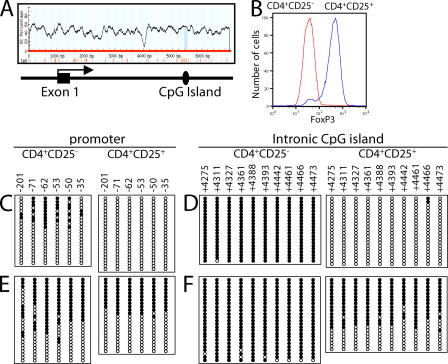
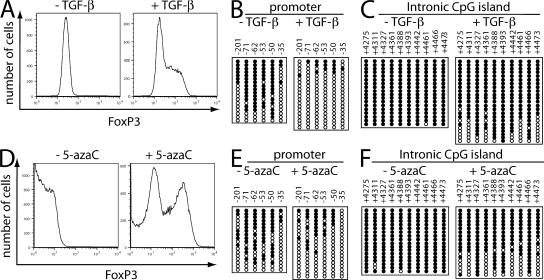
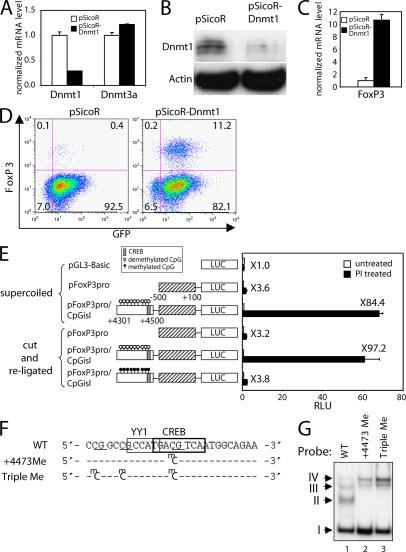
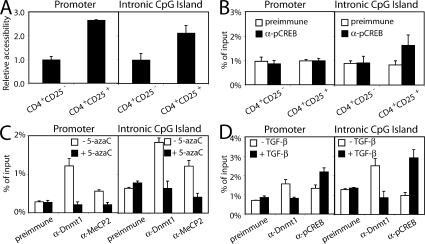
Regulatory T cells (T reg cells) are a population of CD4+ T cells that limit immune responses. FoxP3 is a master control transcription factor for development and function of these cells, but its regulation is poorly understood. We have identified a T cell receptor-responsive enhancer in the FoxP3 first intron that is dependent on a cyclic-AMP response element binding protein (CREB)/activating transcription factor (ATF) site overlapping a CpG island. Methylation of this island inversely correlates with CREB binding and FoxP3 expression. Interestingly, transforming growth factor-beta, which induces T reg cell formation, decreases methylation of the CpG island and increases FoxP3 expression. Similarly, inhibiting methylation with 5-azacytidine or knocking down the DNA methyltransferase Dnmt1 also induces FoxP3 expression. Conversely, methylation of the CpG island, which decreases CREB binding or expression of dominant-negative CREB, decreases FoxP3 gene expression. Thus, T cell receptor-induced FoxP3 expression in T reg cells is controlled both by sequence-specific binding of CREB/ATF and by DNA methylation of a CpG island.


Figures

Figure 1.
Figure 1.
Identification of a TCR response element in the FoxP3 gene. (A) A TCR-responsive enhancer in the CNS3 intronic region of the FoxP3 gene. Conserved noncoding regions are shown in the promoter and first intron regions. Jurkat cells were transfected with the indicated constructs. Transfected cells were either untreated or treated with PMA/ionomycin for 17 h. Results are representative of three or more independent experiments (shown as the mean ± the SD). (B and C) EMSAs with the indicated probes; competitor oligonucleotides were added where indicated. In B, nuclear extracts were obtained from anti-CD3/anti-CD28–activated mouse CD4+ splenic T cells. In C, nuclear extracts were obtained from either CD4+CD25 splenic T cells (lanes 1 and 2) or from natural CD4+CD25+ T reg cells (lanes 3 and 4). (D) EMSA in the presence of specific antibody using WT probes and nuclear extracts from anti-CD3/anti-CD28–activated mouse CD4+ splenic T cells. (E) DNA affinity purification, followed by Western blotting for phospho-CREB, CREB, ATF-1, and ATF-2. Nuclear extracts were from human Kit225 cells stimulated with PMA + ionomycin. (F) The CREB binding site in CNS3 is essential for PI-induced FoxP3 promoter activity. A mutation in the CREB binding site was introduced into FoxP3 reporter construct. Constructs were transfected into Jurkat cells, followed by no stimulation or stimulation with PI for 17 h. (G) Jurkat cells were transfected with the FoxP3 reporter construct plus either empty vector or 0.5 or 5 μg of the ACREB vector. Transfected cells were either untreated or treated with PMA/ionomycin for 17 h. (H) MT-2 cells were infected with the indicated lentiviruses, and puromycin-resistant cells were selected. Real-time PCR was used to analyze FoxP3 and IL-2Rα mRNA levels and normalized to the mRNA level of GAPDH. Results in F–H are representative of three or more independent experiments (shown as the mean ± the SD).
Figure 2.
Figure 2.
DNA methylation status of CpG sites in the promoter and intronic CpG island region of the FoxP3 gene. (A) Identification of a CpG island in the first intron that corresponds to the TCR response element that binds CREB. (B) Expression of FoxP3 in CD4+CD25 versus CD4+CD25+ cells. (C–F) The DNA methylation status for these regions was determined from male (C and D) or female (E and F) C57BL/6 mice by bisulfite sequencing analysis. Each line represents one DNA strand; open circle, unmethylated CpGs; filled circle, methylated CpGs.
Figure 3.
Figure 3.
Expression of the FoxP3 gene in TGF-β–stimulated T reg cells correlates with DNA demethylation, and treatment with 5-azacytidine stimulates FoxP3 expression in non–T reg cells. (A–C) CD4+CD25 cells from male C57BL/6 mice isolated by FACS sorting were stimulated with 5 μg/ml of plate-bound anti-CD3 + 0.5 μg/ml anti- CD28 + 100 U/ml IL-2 in the absence or presence of 5 ng/ml TGF-β for 6 d. (A) The cells were stained with APC-CD4, PerCP-Cy5.5-CD25, and PE-FoxP3. Graphs are shown for FoxP3 expression, gated for live cells. (B and C) The methylation status of CpG sites in the promoter region (B) or the intronic CpG island region (C) was determined by bisulfite sequencing analysis. (D–F) CD4+CD25 cells from male C57BL/6 mice were isolated by FACS sorting and stimulated with 5 μg/ml anti-CD3, 0.5 μg/ml anti-CD28, and 100 U/ml IL-2 for 6 d, and 5-azacytidine was added for days 4–6. (D) The cells were stained with APC-CD4, PerCP-Cy5.5-CD25, and PE-FoxP3. Graphs are shown for FoxP3 expression, gated for live cells. (E and F) The methylation status of CpG sites in the promoter region (E) or the intronic CpG island region (F) was determined by bisulfite sequencing analysis. Each line represents a DNA strand; open circle, unmethylated CpGs; filled circle, methylated CpGs.
Figure 4.
Figure 4.
Knockdown of Dnmt1 induces FoxP3 expression. (A–D) CTLL-2 cells were infected with the indicated lentiviruses, and GFP-positive cells were sorted. (A) Real-time PCR was performed to analyze the mRNA levels of Dnmt1 and Dnmt3a and normalized with the 18S rRNA level. (B) Whole-cell lysates were separated with SDS-PAGE and were subjected to Western blotting using antibodies to Dnmt1 and actin. (C) Real-time PCR was performed to analyze the mRNA levels of FoxP3 expression and normalized with the 18S rRNA level. Results in A and C are representative of at least three independent experiments (shown as the mean ± the SD). (D) Dot plot showing the expression of FoxP3 in CTLL-2 cells infected with the indicated lentiviruses. (E–G) Essential role of CREB and its methylation for FoxP3 expression. (E) Inhibition of the FoxP3 promoter activity by methylation at CpG sites in the intronic CpG island. Jurkat cells were transfected with the indicated constructs. Transfected cells were either untreated or treated with PMA/ionomycin for 17 h. Results in E are representative experiments (shown as the mean ± the SD). (F) Sequence of DNA probes used in EMSAs in G. (G) EMSA using a WT probe or probes methylated at the indicated CpGs and nuclear extracts from mouse splenic CD4+ T cells expanded with anti-CD3, anti-CD28, and IL-2 for 6 d.
Figure 5.
Figure 5.
REA assay with RsaI at the promoter and CNS3 CpG island regions of the FoxP3 locus. (A) The data were quantitated using a two-step nested real-time PCR strategy and expressed as a ratio of digestion at the FoxP3 promoter or CNS3 to digestion at the Actin gene locus. (B) ChIP at the promoter and CNS3 CpG island regions of the FoxP3 locus revealing phospho-CREB binding only to the CpG island region in CD4+CD25+ T reg cells. (C) CTLL-2 cells cultured in the presence of 100 U/ml IL-2 for 6 d were incubated with 5-azacytidine for the last 3 d, and ChIP assays were performed with preimmune serum or antibodies to MeCP2 or Dnmt1. (D) CD4+CD25 cells from male C57BL/6 mice isolated by FACS sorting were stimulated with 5 μg/ml anti-CD3, 0.5 μg/ml anti-CD28, and 100 U/ml IL-2 in the absence or presence of 5 ng/ml TGF-β for 6 d. ChIP assays were performed with preimmune serum or antibodies to Dnmt1 or phospho-CREB. Results are representative of three or more independent experiments (shown as the mean ± the SD).

References

    1. Sakaguchi, S., M. Ono, R. Setoguchi, H. Yagi, S. Hori, Z. Fehervari, J. Shimizu, T. Takahashi, and T. Nomura. 2006. Foxp3CD25CD4 natural regulatory T cells in dominant self-tolerance and autoimmune disease. Immunol. Rev. 212:8–27. - PubMed
    1. Fontenot, J.D., M.A. Gavin, and A.Y. Rudensky. 2003. Foxp3 programs the development and function of CD4+CD25+ regulatory T cells. Nat. Immunol. 4:330–336. - PubMed
    1. Ziegler, S.F. 2006. FOXP3: of mice and men. Annu. Rev. Immunol. 24:209–226. - PubMed
    1. Bettelli, E., M. Dastrange, and M. Oukka. 2005. Foxp3 interacts with nuclear factor of activated T cells and NF-kappa B to repress cytokine gene expression and effector functions of T helper cells. Proc. Natl. Acad. Sci. USA. 102:5138–5143. - PMC - PubMed
    1. Wu, Y., M. Borde, V. Heissmeyer, M. Feuerer, A.D. Lapan, J.C. Stroud, D.L. Bates, L. Guo, A. Han, S.F. Ziegler, et al. 2006. FOXP3 controls regulatory T cell function through cooperation with NFAT. Cell. 126:375–387. - PubMed

Publication types

MeSH terms

Substances