. 2007 Jul 9;204(7):1665-75.
doi: 10.1084/jem.20070618. Epub 2007 Jun 25.

Bim/Bcl-2 balance is critical for maintaining naive and memory T cell homeostasis

Affiliations

Bim/Bcl-2 balance is critical for maintaining naive and memory T cell homeostasis

Sara Wojciechowski et al. J Exp Med. .

Abstract

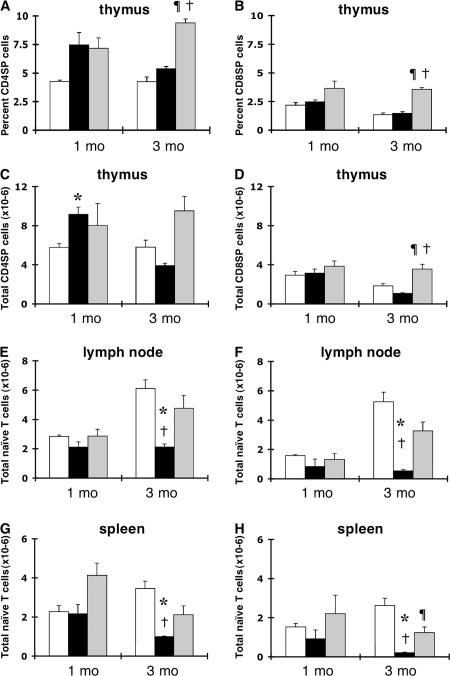
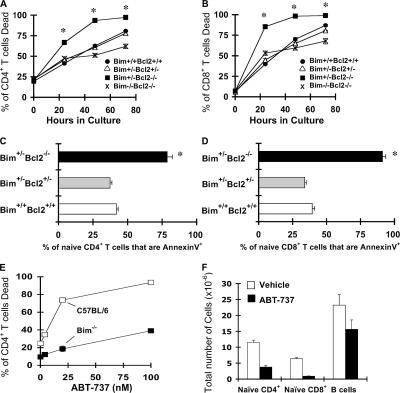
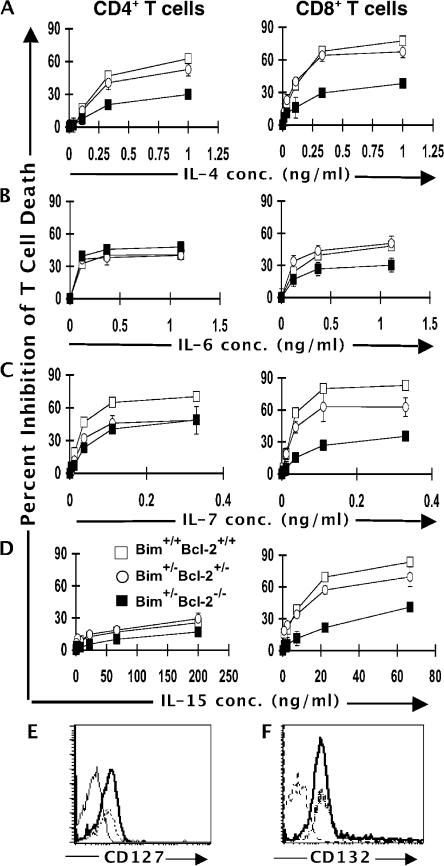
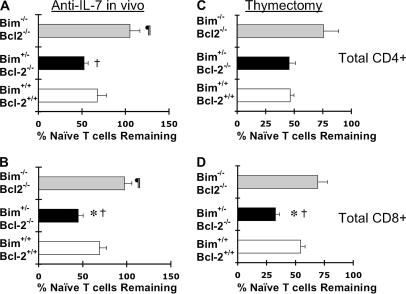
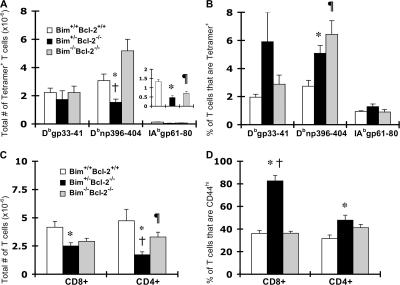
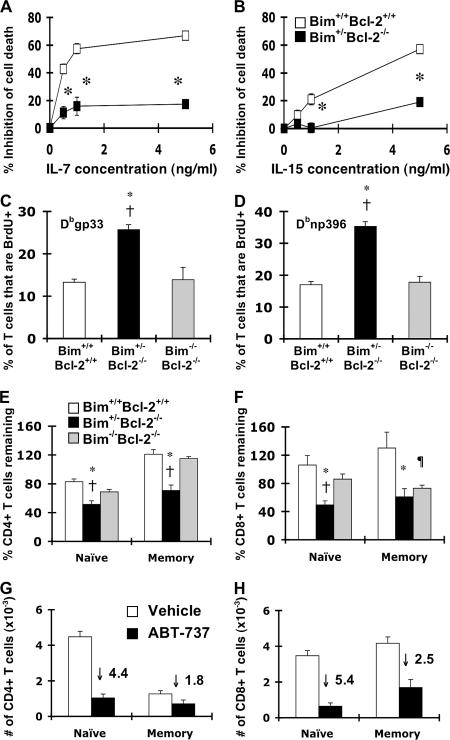
We examined the role of the antiapoptotic molecule Bcl-2 in combating the proapoptotic molecule Bim in control of naive and memory T cell homeostasis using Bcl-2(-/-) mice that were additionally deficient in one or both alleles of Bim. Naive T cells were significantly decreased in Bim(+/-)Bcl-2(-/-) mice, but were largely restored in Bim(-/-)Bcl-2(-/-) mice. Similarly, a synthetic Bcl-2 inhibitor killed wild-type, but not Bim(-/-), T cells. Further, T cells from Bim(+/-)Bcl-2(-/-) mice died rapidly ex vivo and were refractory to cytokine-driven survival in vitro. In vivo, naive CD8(+) T cells required Bcl-2 to combat Bim to maintain peripheral survival, whereas naive CD4(+) T cells did not. In contrast, Bim(+/-)Bcl-2(-/-) mice generated relatively normal numbers of memory T cells after lymphocytic choriomeningitis virus infection. Accumulation of memory T cells in Bim(+/-)Bcl-2(-/-) mice was likely caused by their increased proliferative renewal because of the lymphopenic environment of the mice. Collectively, these data demonstrate a critical role for a balance between Bim and Bcl-2 in controlling homeostasis of naive and memory T cells.


Figures

Figure 1.
Figure 1.
Dramatic loss of peripheral T cells, but not thymocytes, in Bim+/−Bcl-2−/− mice with age. Groups of Bim +/+ Bcl-2 +/+ (n = 3 mice/time point; open bars), Bim +/ Bcl-2 / (n = 4 mice/time point; shaded bars), or Bim / Bcl-2 / (n = 4 mice/time point; gray bars) mice were killed at either 1 or 3 mo of age, and thymuses, spleens, and peripheral LNs were removed. Cells were stained with antibodies against TCR, CD44, CD4, and CD8. For thymus analysis, results show the percentage of CD4 (A) or CD8 (B) SP cells and the absolute number of CD4 (C) or CD8 (D) SP cells ± the SEM. For LN (E and F) and spleen (G and H) analysis, results show the absolute number of naive CD44lo CD4+ T cells (E and G) or naive CD44lo CD8+ T cells (F and H) ± the SEM. *, statistically significant difference between Bim +/ Bcl-2 / and Bim +/+ Bcl-2 +/+ mice (number of CD4SP cells in thymus, P ≤ 0.02; number of CD4s in LN and spleen, P ≤ 0.02; number of CD8s in LN and spleen, P ≤ 0.02); †, statistically significant difference between Bim +/ Bcl-2 / and Bim / Bcl-2 / mice (percentage of CD4SP cells in thymus, P ≤ 0.001; number of CD4SP cells in thymus, P ≤ 0.03; percentage of CD8SP cells in thymus, P ≤ 0.001; number of CD8SP cells in thymus, P ≤ 0.01; number of CD4s in LN, P ≤ 0.05; number of CD4s in spleen, P ≤ 0.04; number of CD8s in LN, P ≤ 0.02; number of CD8s in spleen, P ≤ 0.05); ¶, statistically significant difference between Bim / Bcl-2 / and Bim +/+ Bcl-2 +/+ mice (percentage of CD4SP cells in thymus, P ≤ 0. 001; percentage and number of CD8SP cells in thymus, P ≤ 0.001 and P ≤ 0.03; number of CD8s in spleen, P ≤ 0.03).
Figure 2.
Figure 2.
Naive Bcl-2–deficient T cells exhibit increased Bim-mediated death. LN cells from individual naive Bim +/+ Bcl-2 +/+ (filled circles); Bim +/ Bcl-2 +/ (open triangles); Bim +/ Bcl-2 / (filled squares); or Bim / Bcl-2 / mice (x marks; n = 3 mice/group) were cultured at 37°C and at various times were stained with antibodies against TCR-β and either CD4 or CD8 and propidium iodide, and cell death was assessed by flow cytometry. Results show the percentage of CD4+ (A) or CD8+ (B) T cells that were PI+ (dead) ± the SEM. *, statistically significant difference in the death of CD4+ and CD8+ T cells from Bim +/ Bcl-2 / mice compared with all other groups (for CD4s P ≤ 0.009; for CD8s P ≤ 0.007). At 48 and 72 h, the death of CD4+ and CD8+ T cells from Bim / Bcl-2 / mice was significantly decreased compared with Bim +/+ Bcl-2 +/+ mice (for CD4s P ≤ 0.02; for CD8s P ≤ 0.05). Similarly, LN cells were cultured at 37°C and stained with antibodies against TCR-β, CD44, CD4 or CD8, and AnnexinV-FITC. Cell death was assessed by flow cytometry. Results show the percentage of naive (CD44lo) CD4+ (C) and CD8+ (D) T cells that were AnnexinV+ (apoptotic or dead) ± the SEM. Death of naive CD4+ and CD8+ T cells from Bim +/ Bcl-2 / mice was significantly increased compared with all other groups (P ≤ 0.01). These data are representative of two independent experiments with similar results. (E) LN cells from either C57BL/6 (open squares) or Bim / (filled squares) mice were cultured with the indicated concentrations of ABT-737 for 24 h. Results show the percentage of CD4+ T cells (dead) ± the SEM (similar results were obtained with CD8+ T cells). (F) Groups of C57BL/6 mice (n = 4 mice/group) were injected i.p. with either vehicle (open bars) or ABT-737 (shaded bars) for 14 d and killed, and cell numbers were quantified by flow cytometric analysis. Results show the absolute numbers of CD4+ T cells, CD8+ T cells, and B cells present in the LN ± the SEM. Similar results were obtained in the spleen.
Figure 3.
Figure 3.
Bcl-2 is required for cytokine-mediated survival of naive T cells in vitro. LN cells from individual naive Bim +/+ Bcl-2 +/+ (open squares), Bim +/ Bcl-2 +/ (open circles), or Bim +/ Bcl-2 / (filled squares) mice (n = 3 mice/group) were cultured at 37°C with IL-4 (A), -7 (B), -6 (C), or -15 (D) for 36 h at the concentrations shown. After culture, cells were stained with antibodies to TCR and CD8 and propidium iodide and cell death was assessed by flow cytometry. Cell death before culture was negligible. Results show the percentage of inhibition of cell death ([{percentage of T cells dead in medium − percentage of T cells dead in cytokine} / percentage of T cells dead in medium] × 100) ± the SD, and they are representative of three independent experiments. LN cells from either Bim +/+ Bcl-2 +/+ (thick line) or Bim +/ Bcl-2 / (dotted line) mice were also assessed for expression of IL-7Rα (CD127; E) and γc (CD132; F) by flow cytometry. Staining of cells with isotype control antibody is shown by the thin line). These data are representative of two independent experiments with similar results.
Figure 4.
Figure 4.
Bcl-2 is critical to prevent the proapoptotic effects of Bim in naive CD8+ T cells in vivo. (A and B) Groups of 6–9-wk-old Bim +/+ Bcl-2 +/+ (n = 9 mice/group), Bim +/ Bcl-2 / (n = 9 mice/group), or Bim / Bcl-2 / (n = 9 mice/group) mice were injected i.p. with 3 mg of either control IgG (n = 4 mice/genotype) or M25 (n = 5 mice/genotype) 1 and 4 d before sacrifice. 7 d after the initial injection, LN and spleen cells were stained with antibodies against CD4, CD8, CD62L, and CD44, data were acquired by flow cytometry, and absolute numbers of naive CD44lo CD62Lhi phenotype T cells in each organ were determined. Results show the percentage of naive CD44lo CD62Lhi CD4+ (A) and CD8+ (B) T cells (combined LN and spleen) remaining in anti–IL-7–treated mice relative to control mAb–treated mice. *, statistically significant difference between Bim +/+ Bcl-2 +/+ and Bim +/ Bcl-2 / mice (P ≤ 0.04); †, statistically significant difference between Bim +/ Bcl-2 / and Bim / Bcl-2 / mice (CD4, P ≤ 0.008; CD8, P ≤ 0.002); ¶, statistically significant difference between Bim / Bcl-2 / and Bim +/+ Bcl-2 +/+ mice (CD4 and CD8, P ≤ 0.05). (C and D) Groups of 6–9-wk-old Bim +/+ Bcl-2 +/+ (n = 3 mice/group), Bim +/ Bcl-2 / (n = 8 mice/group), or Bim / Bcl-2 / (n = 6 mice/group) mice were either thymectomized or sham thymectomized. 4 wk after thymectomy, spleens and LN cells were stained with antibodies against CD4, CD8, and CD44, and data were acquired by flow cytometry. Data are pooled from two independent experiments. Results show the percentage of naive T cells (CD44lo; combined LN and spleen) remaining in thymectomized mice relative to sham-thymectomized controls ± the SEM. Similar results were observed at 2 wk after thymectomy. *, statistically significant difference between Bim +/+ Bcl-2 +/+ and Bim +/ Bcl-2 / mice (P ≤ 0.003); †, statistically significant difference between Bim +/ Bcl-2 / and Bim / Bcl-2 / mice (P ≤ 0.016).
Figure 5.
Figure 5.
Bcl-2–independent generation of memory T cells. Groups of Bim +/+ Bcl-2 +/+, Bim +/ Bcl-2 /, and Bim / Bcl-2 / mice (n = 4–6 mice/group) were injected i.p. with 2 × 10⁵ pfu LCMV and killed 141 d later. Single spleen cell suspensions were stained with MHC tetrameric staining reagents and antibodies against CD16/32, CD62L, and either CD4 or CD8, and then analyzed by flow cytometry. Results show the numbers (A) and percentages (B) of LCMV-specific CD8+ (Dbgp33-41 and Dbnp396-404) and CD4+ (I-Abgp61-80; inset) T cells in the spleen (106) ± the SEM. Spleen cells were also stained with antibodies against CD4, CD8, and CD44 to assess the numbers of memory T cells across the genotypes. Results show the total numbers (C) and percentages (D) of CD44hi (memory) CD8+ and CD4+ T cells ± the SEM. *, statistically significant difference between Bim +/ Bcl-2 / and Bim +/+ Bcl-2 +/+ mice for Dbnp396+ T cells (number and percentage of cells, P ≤ 0.02); for total memory CD8s (number of cells, P ≤ 0.02; percentage of cells, P ≤ 0.001); for total memory CD4s (number of cells, P ≤ 0.02; percentage of cells, P ≤ 0.03). †, statistically significant difference between Bim +/ Bcl-2 / and Bim / Bcl-2 / mice, total number of Dbnp396+ (P ≤ 0.02); for total memory CD8s (percentage of cells, P ≤ 0.001); for total memory CD4s (number of cells, P ≤ 0.03). ¶, statistically significant difference between Bim / Bcl-2 / and Bim +/+ Bcl-2 +/+ mice, total number of IAbgp61+ (P ≤ 0. 005); percentage of Dbnp396+ (P ≤ 0.03); for total memory CD8s (number of cells, P ≤ 0.05). This experiment is representative of two independent experiments with similar results.
Figure 6.
Figure 6.
Accumulation of memory T cells in Bim+/−Bcl-2−/− mice is caused by increased proliferation rather than survival. Groups of Bim +/+ Bcl-2 +/+ and Bim +/ Bcl-2 / mice (n = 3 mice/group) were killed, and LN cells from individual mice were cultured with the indicated concentrations of IL-7 (A) or -15 (B) for 36 h at 37°C. After culture, cells were stained with antibodies against TCR-β, CD8, and CD44 to identify endogenous memory phenotype T cells and with Annexin V-FITC (R&D Systems) to identify cells that were dead, and then analyzed by flow cytometry. Results show the percentage of inhibition of cell death ([{percentage of cells dead in medium – percentage of cells dead in cytokine} / percentage of cells dead in medium] × 100) ± the SD. Cell death without cytokine was 50.9 ± 2.5% for Bim +/+ Bcl-2 +/+ and 74.8 ± 5.4% for Bim +/ Bcl-2 / mice. *, statistically significant difference between Bim +/+ Bcl-2 +/+ and Bim +/ Bcl-2 / mice for IL-7 (P ≤ 0.001) and -15 (P ≤ 0.03). (C and D) Groups of Bim +/+ Bcl-2 +/+ (n = 6) and Bim +/ Bcl-2 / mice (n = 5) were infected with LCMV. At day 126 after infection, mice were injected once daily with BrdU for 14 d. On day 141, mice were killed and BrdU accumulation within memory T cells was assessed by staining cells for CD8, CD62L, MHC tetramer, and intracellular BrdU. Results show the percentage of tetramer+CD62L+CD8+ T cells that are BrdU+ ± the SEM. Percentages of Dbgp33+ (C) and Dbnp396+ (D) T cells that were BrdU+ were significantly increased in Bim +/ Bcl-2 / mice compared with either Bim +/+ Bcl-2 +/+ or Bim / Bcl-2 / mice (P ≤ 0.002 for both). (E and F) Adoptive transfer experiments. T cells were purified from LN and spleens of 2-mo-old Bim +/+ Bcl-2 +/+, Bim +/ Bcl-2 /, and Bim / Bcl-2 / mice. 2 × 10⁶ T cells were transferred into Ly5.1 congenic recipient mice (n = 12 mice/group); on days 1 (n = 6 mice/group) and 10 (n = 6 mice/group), recipient mice were killed and donor T cells were quantified in their LNs and spleens by flow cytometry. Results show the percentage of donor naive and memory CD4+ (E) or CD8+ (F) T cells (combined LN and spleen) remaining on day 10, relative to the number present on day 1 after transfer ± the SEM. (G and H) Purified T cells from 20-mo-old C57BL/6 mice were transferred into Ly5.1 congenic mice (n = 8). Recipient mice were treated with either vehicle (n = 4) or with ABT-737 (n = 4) for 10 d, and the number of donor naive and memory T cells was quantified by flow cytometry. Results show the total number of donor CD4+ (G) and CD8+ (H) naive versus memory T cells in mice treated with either vehicle (open bars) or ABT-737 (shaded bars) ± the SEM. Numbers above the shaded bars indicate the fold decrease in cell number by ABT-737. Similar results were obtained in mice without cell transfer.

Similar articles

Cited by

References

    1. Kennedy, M.K., M. Glaccum, S.N. Brown, E.A. Butz, J.L. Viney, M. Embers, N. Matsuki, K. Charrier, L. Sedger, C.R. Willis, et al. 2000. Reversible defects in natural killer and memory CD8 T cell lineages in interleukin 15–deficient mice. J. Exp. Med. 191:771–780. - PMC - PubMed
    1. Goldrath, A.W., P.V. Sivakumar, M. Glaccum, M.K. Kennedy, M.J. Bevan, C. Benoist, D. Mathis, and E.A. Butz. 2002. Cytokine requirements for acute and basal homeostatic proliferation of naive and memory CD8+ T cells. J. Exp. Med. 195:1515–1522. - PMC - PubMed
    1. Becker, T.C., E.J. Wherry, D. Boone, K. Murali-Krishna, R. Antia, A. Ma, and R. Ahmed. 2002. Interleukin 15 is required for proliferative renewal of virus-specific memory CD8 T cells. J. Exp. Med. 195:1541–1548. - PMC - PubMed
    1. Tan, J.T., B. Ernst, W.C. Kieper, E. LeRoy, J. Sprent, and C.D. Surh. 2002. Interleukin (IL)-15 and IL-7 jointly regulate homeostatic proliferation of memory phenotype CD8+ cells but are not required for memory phenotype CD4+ cells. J. Exp. Med. 195:1523–1532. - PMC - PubMed
    1. Ku, C.C., M. Murakami, A. Sakamoto, J. Kappler, and P. Marrack. 2000. Control of homeostasis of CD8+ memory T cells by opposing cytokines. Science. 288:675–678. - PubMed

Publication types

MeSH terms