

Peripapillary nerve fiber layer thickness profile determined with high speed, ultrahigh resolution optical coherence tomography high-density scanning
- PMID: 17591885
- PMCID: PMC1950319
- DOI: 10.1167/iovs.06-1416
Peripapillary nerve fiber layer thickness profile determined with high speed, ultrahigh resolution optical coherence tomography high-density scanning
Abstract
Purpose: To determine the retinal nerve fiber layer (RNFL) thickness profile in the peripapillary region of healthy eyes.
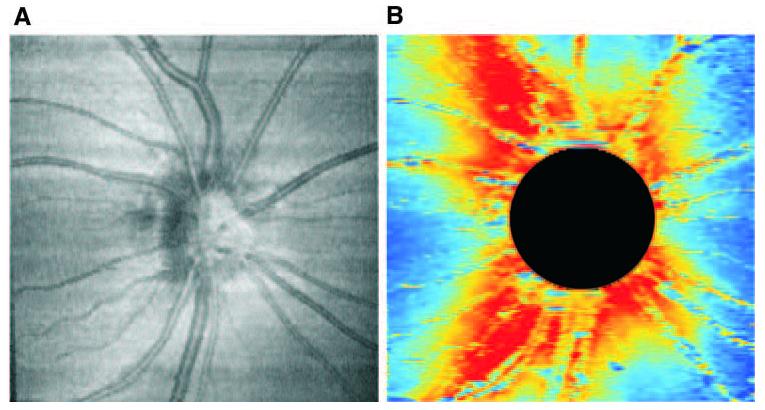
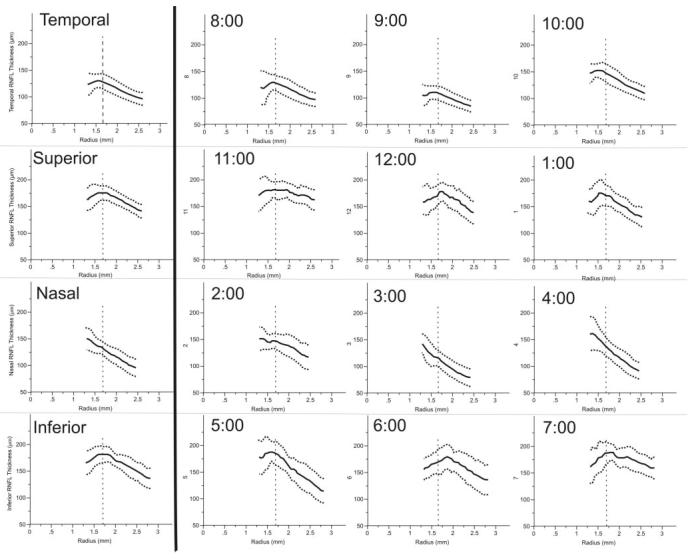
Methods: Three-dimensional, Fourier/spectral domain optical coherence tomography (OCT) data were obtained as raster scan data (512 x 180 axial scans in a 6 x 6-mm region centered on the optic nerve head [ONH]) with high-speed, ultrahigh-resolution OCT (hsUHR-OCT) from 12 healthy subjects. RNFL thickness was measured on this three-dimensional data set with an in-house software program. The disc margin was defined subjectively in each image and RNFL thickness profiles relative to distance from the disc center were computed for quadrants and clock hours. A mixed-effects model was used to characterize the slope of the profiles.
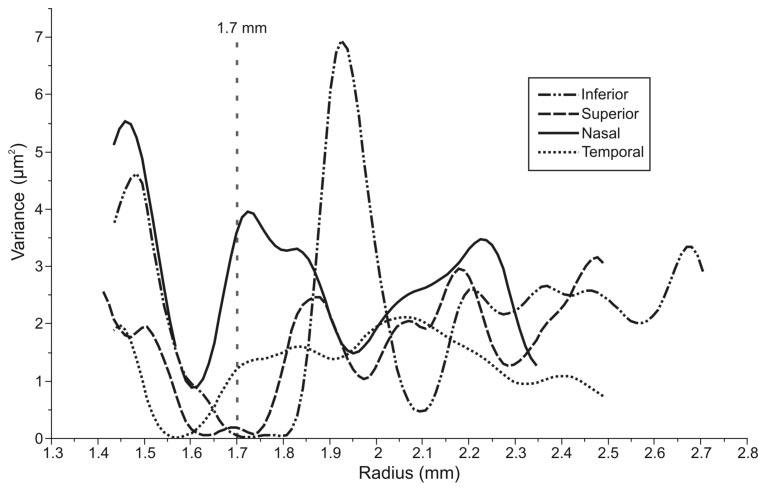
Results: Thickness profiles in the superior, inferior, and temporal quadrants showed an initial increase in RNFL thickness, an area of peak thickness, and a linear decrease as radial distance from the disc center increased. The nasal quadrant showed a constant linear decay without the initial RNFL thickening. A mixed-effects model showed that the slopes of the inferior, superior, and nasal quadrants differed significantly from the temporal slope (P = 0.0012, P = 0.0003, and P = 0.0004, respectively).
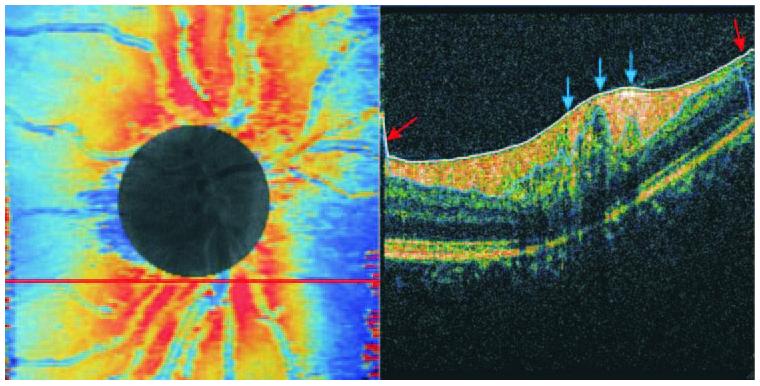
Conclusions: RNFL thickness is generally inversely related to the distance from the ONH center in the peripapillary region of healthy subjects, as determined by hsUHR-OCT. However, several areas showed an initial increase in RNFL, followed by a peak and a gradual decrease.
Figures


References
-
- Hoyt WH, Frisen L, Newman NM. Fundoscopy of nerve fiber layer defects in glaucoma. Invest Ophthalmol Vis Sci. 1973;12:814–829. - PubMed
-
- Quigley HA, Miller NR, George T. Clinical evaluation of nerve fiber layer atrophy as an indicator of glaucomatous optic nerve damage. Arch Ophthalmol. 1980;98:1564–1571. - PubMed
-
- Airaksinen PJ, Drance SM, Douglas GR, Mawson DK, Nieminen H. Diffuse and localized nerve fiber loss in glaucoma. Am J Ophthalmol. 1984;98:566–571. - PubMed
-
- Sommer A, Katz J, Quigley HA, et al. Clinically detectable nerve fiber atrophy precedes the onset of glaucomatous field loss. Arch Ophthalmol. 1991;109:77–83. - PubMed
-
- Hee MR, Izatt JA, Swanson EA, et al. Optical coherence tomography of the human retina. Arch Ophthalmol. 1995;113:325–332. - PubMed
Publication types
MeSH terms
Grants and funding
LinkOut - more resources
Full Text Sources
Other Literature Sources
