

Global changes in optic nerve head gene expression after exposure to elevated intraocular pressure in a rat glaucoma model
- PMID: 17591886
- PMCID: PMC1950563
- DOI: 10.1167/iovs.06-1282
Global changes in optic nerve head gene expression after exposure to elevated intraocular pressure in a rat glaucoma model
Abstract
Purpose: In glaucoma, the optic nerve head (ONH) is the likely site of initial injury and elevated intraocular pressure (IOP) is the best-known risk factor. This study determines global gene expression changes in the pressure-injured ONH.
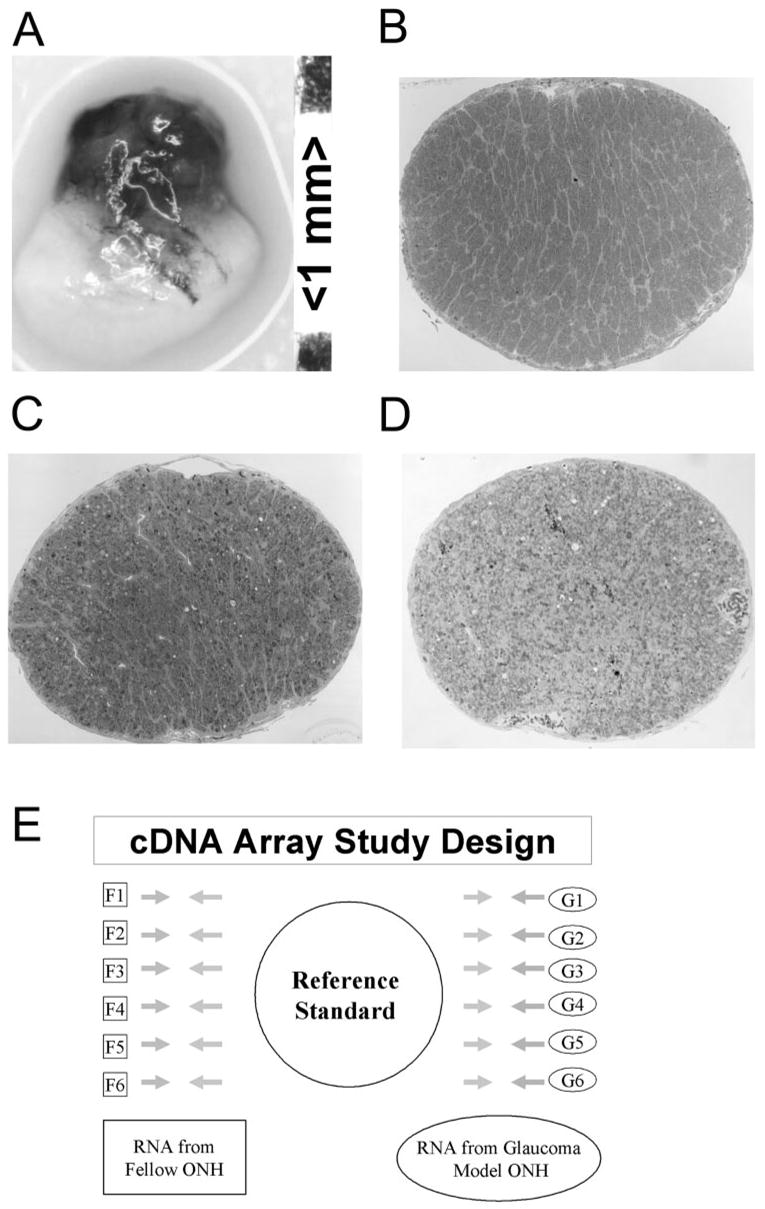
Methods: Unilateral sustained IOP elevation (glaucoma, n = 46) or optic nerve transection (n = 10) was produced in rats. ONHs were removed, and the retrobulbar optic nerves were graded for degeneration. Gene expression in the glaucomatous ONH with extensive injury was compared with that in the fellow ONH (n = 6/group), by using cDNA microarrays. Data from 12 arrays were normalized, significant differences in gene expression determined, and significantly affected gene classes identified. For the remaining ONH, grouped by experimental condition and degree of injury, quantitative reverse transcriptase-PCR (qPCR) and ANOVA were used to compare selected message levels.
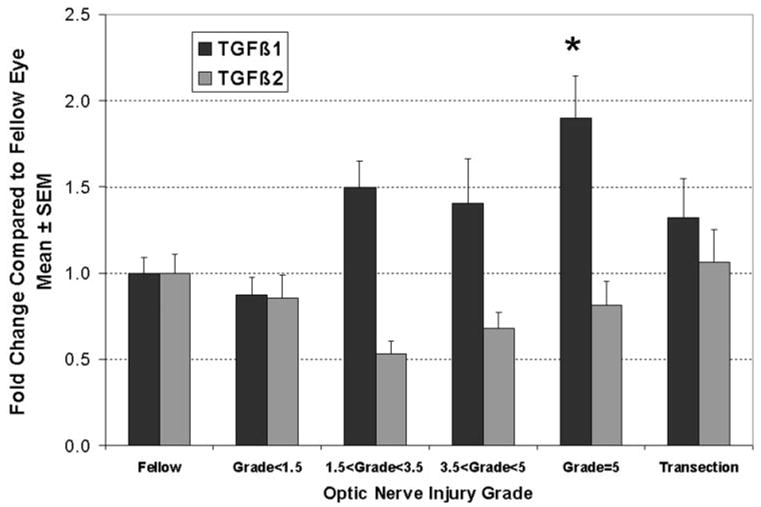
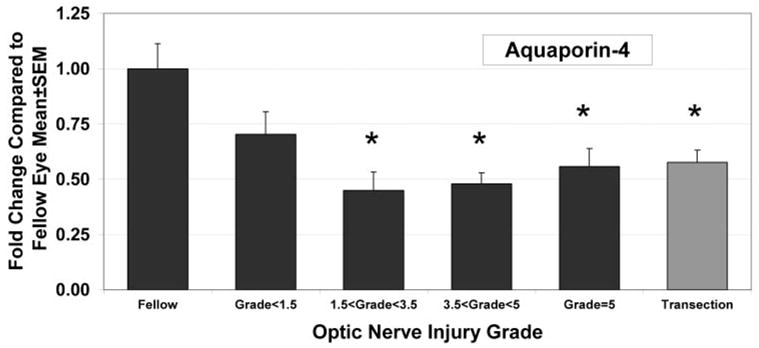
Results: Microarray analysis identified more than 2000 significantly regulated genes. For 225 of these genes, the changes were greater than twofold. The most significantly affected gene classes were cell proliferation, immune response, lysosome, cytoskeleton, extracellular matrix, and ribosome. A 2.7-fold increase in ONH cellularity confirmed glaucoma model cell proliferation. By qPCR, increases in levels of periostin, collagen VI, and transforming growth factor beta1 were linearly correlated to the degree of IOP-induced injury. For cyclinD1, fibulin 2, tenascin C, TIMP1, and aquaporin-4, correlations were significantly nonlinear, displaying maximum change with focal injury.
Conclusions: In the ONH, pressure-induced injury results in cell proliferation and dramatically altered gene expression. For specific genes, expression levels were most altered by focal injury, suggesting that further array studies may identify initial, and potentially injurious, altered processes.
Figures
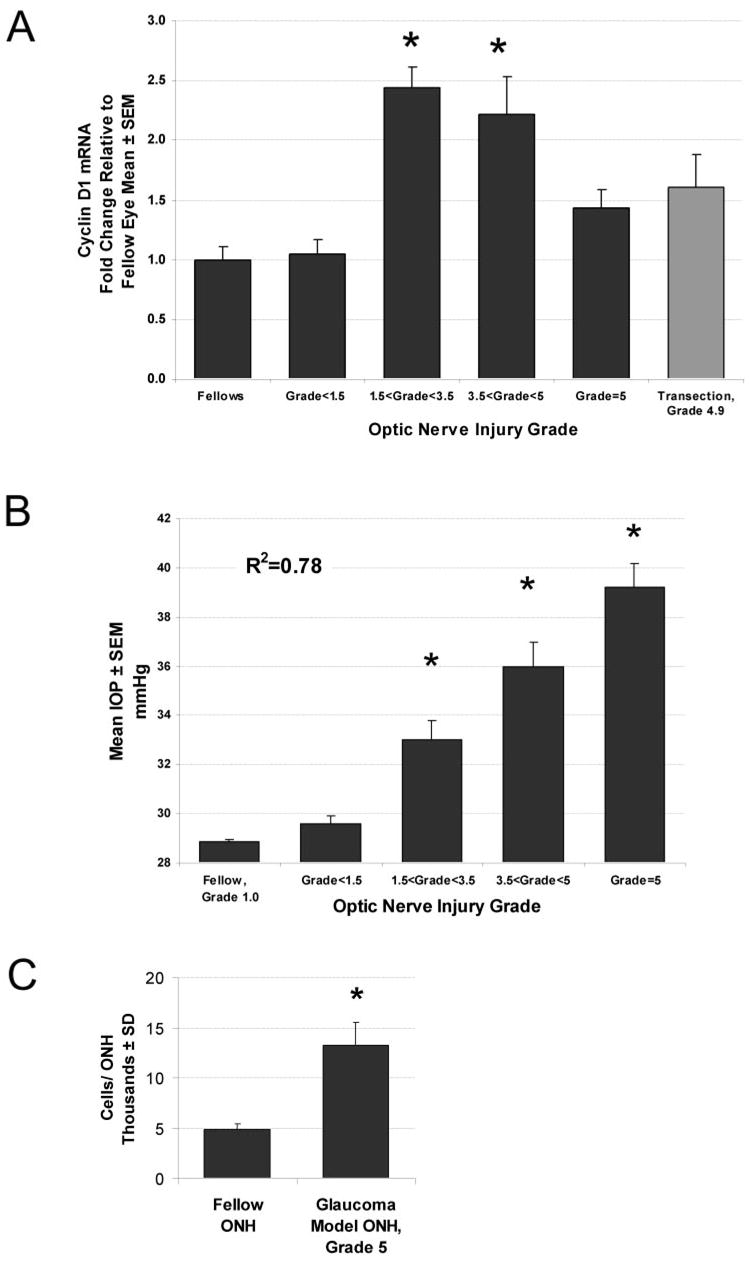
 ) For comparison, ONH from eyes with transected optic nerves (n = 7) are shown. Each bar represents the mean ± SEM for that group relative to the mean for untreated fellow eyes (n = 14). *Significant increases compared with fellow eye levels (ANOVA with the Dunnett posttest, P < 0.01). (B) In a pressure-injured ONH, the relationship of mean IOP to optic nerve injury grade is shown over the 5-week experimental period, by group. Mean IOP differences between groups are significant for all injury groups (*P < 0.05), except that between fellow and injury grade <1.5. For two separate groups of fellow and grade-5 ONH, total DNA measurements are shown in (C), illustrating the approximately threefold increase in cellularity in ONH with grade-5 optic nerve damage due to elevated IOP (*P < 0.000002).
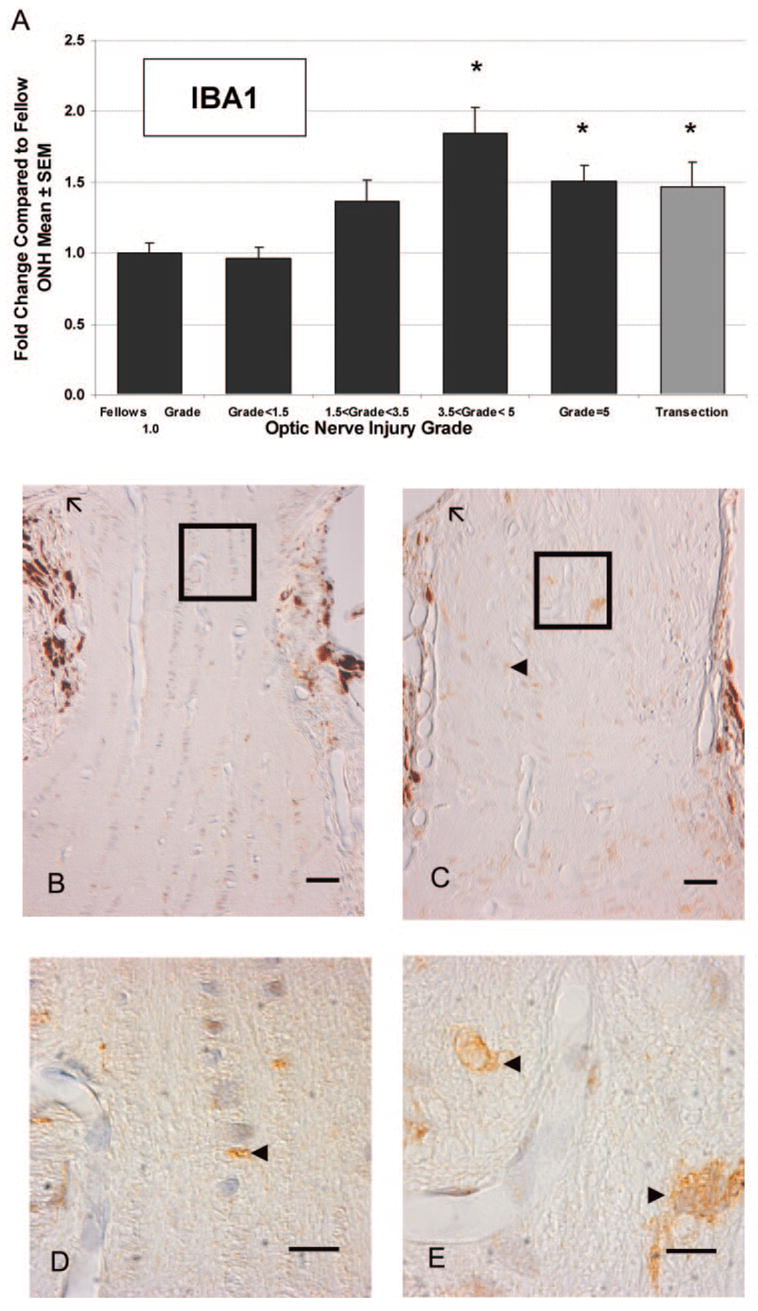 ). Immunohistochemical labeling indicated activation and potential proliferation of ONH microglia. Representative fellow ONH (B) and glaucoma model ONH with an optic nerve injury grade of 3.6 (C). (D, E) Higher magnifications of the boxed regions in (B) and (C), respectively. Arrowheads: labeled cells; arrows: Bruch’s membrane. Brown: chromogen labeling; pale blue: counterstained nuclei. Scale bars: (B, C) 10 μm; (D, E) 3 μm.
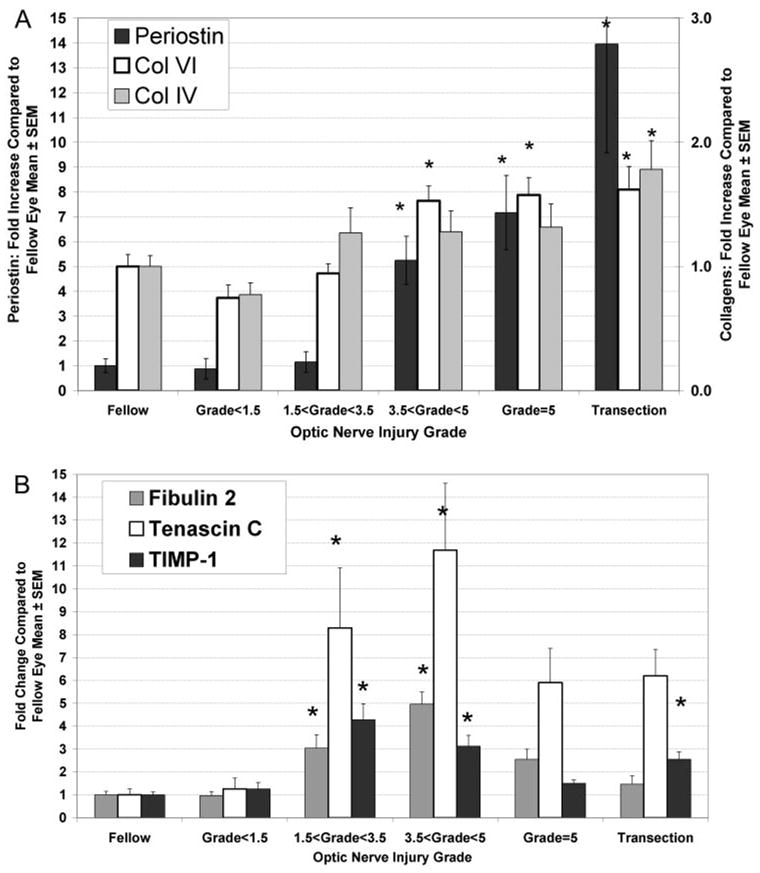
References
-
- Sommer A, Katz J, Quigley HA, et al. Clinically detectable nerve fiber atrophy precedes the onset of glaucomatous field loss. Arch Ophthalmol. 1991;109:77–83. - PubMed
-
- Burgoyne CF, Downs JC, Bellezza AJ, Suh JK, Hart RT. The optic nerve head as a biomechanical structure: a new paradigm for understanding the role of IOP-related stress and strain in the pathophysiology of glaucomatous optic nerve head damage. Prog Retin Eye Res. 2005;24:39–73. - PubMed
-
- Quigley HA, Addicks EM, Green WR, Maumenee AE. Optic nerve damage in human glaucoma. II. The site of injury and susceptibility to damage. Arch Ophthalmol. 1981;99:635–649. - PubMed
-
- Tuulonen A, Airaksinen PJ. Initial glaucomatous optic disk and retinal nerve fiber layer abnormalities and their progression. Am J Ophthalmol. 1991;111:485–490. - PubMed
Publication types
MeSH terms
Substances
Grants and funding
LinkOut - more resources
Full Text Sources
Medical
Research Materials
Miscellaneous
