. 2007 Jul 2;178(1):43-56.
doi: 10.1083/jcb.200701139. Epub 2007 Jun 25.

A role for Rab5 in structuring the endoplasmic reticulum

Affiliations

A role for Rab5 in structuring the endoplasmic reticulum

Anjon Audhya et al. J Cell Biol. .

Erratum in

  • J Cell Biol. 2007 Sep 24;178(7):1309

Abstract

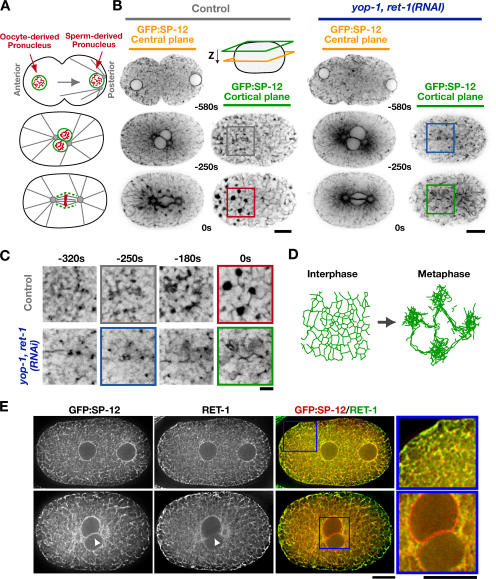
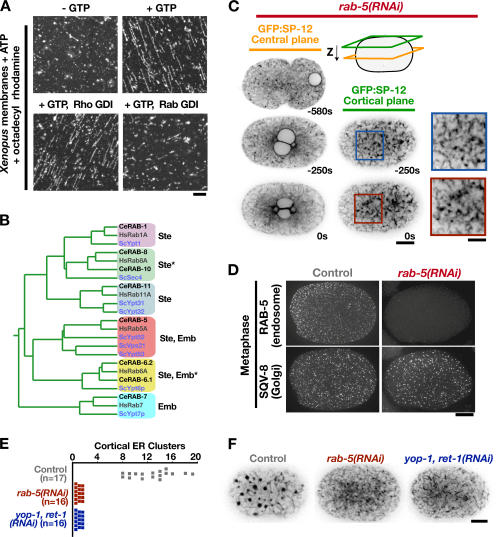
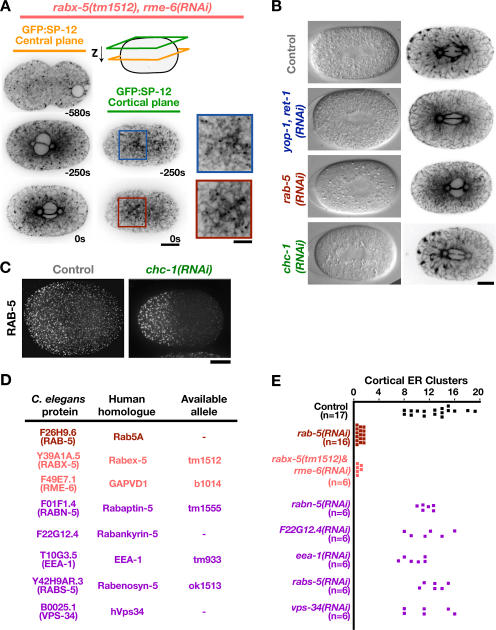
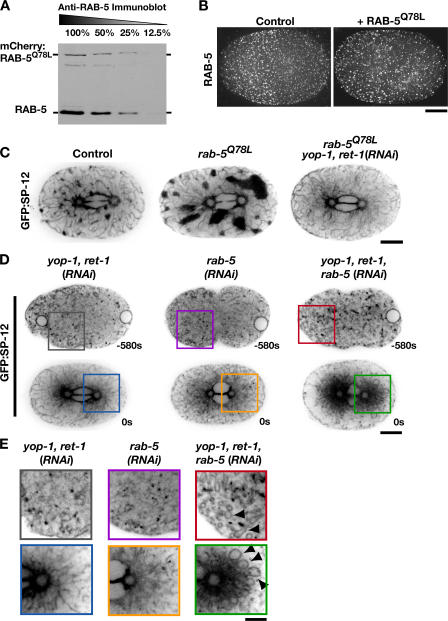
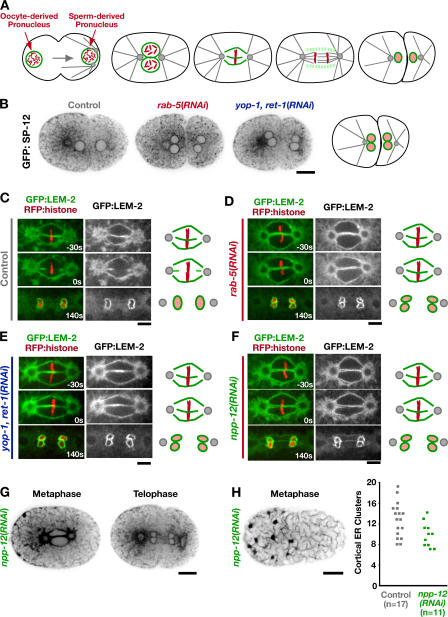
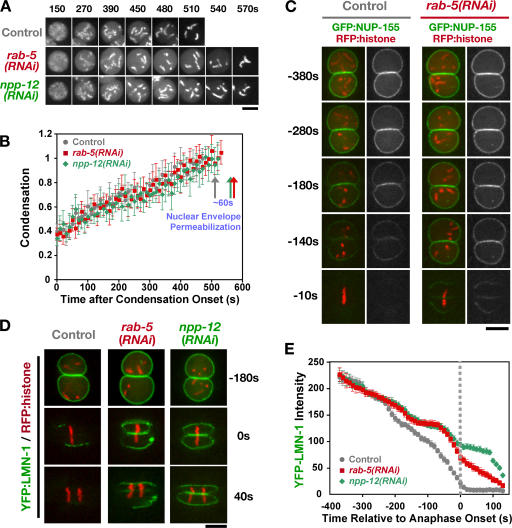
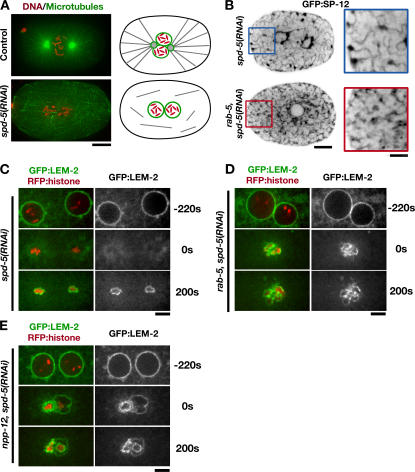
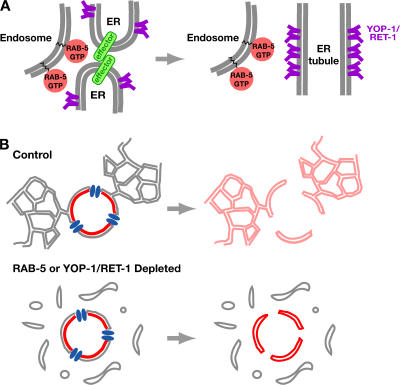
The endoplasmic reticulum (ER) is a contiguous network of interconnected membrane sheets and tubules. The ER is differentiated into distinct domains, including the peripheral ER and nuclear envelope. Inhibition of two ER proteins, Rtn4a and DP1/NogoA, was previously shown to inhibit the formation of ER tubules in vitro. We show that the formation of ER tubules in vitro also requires a Rab family GTPase. Characterization of the 29 Caenorhabditis elegans Rab GTPases reveals that depletion of RAB-5 phenocopies the defects in peripheral ER structure that result from depletion of RET-1 and YOP-1, the C. elegans homologues of Rtn4a and DP1/NogoA. Perturbation of endocytosis by other means did not affect ER structure; the role of RAB-5 in ER morphology is thus independent of its well-studied requirement for endocytosis. RAB-5 and YOP-1/RET-1 also control the kinetics of nuclear envelope disassembly, which suggests an important role for the morphology of the peripheral ER in this process.


Figures

Figure 1.
Figure 1.
RET-1 and YOP-1 are redundantly required for ER morphology. (A) Schematics illustrate events during the first mitotic division of the C. elegans embryo. (B) Spinning-disk confocal optics were used to image the ER marker GFP:SP-12 in control embryos (n = 18) and embryos depleted of YOP-1 and RET-1 by RNAi (yop-1, ret-1[RNAi]; n = 13). Representative images of a central plane (yellow) and a cortical plane just beneath the embryo surface (green) from control (left) and yop-1, ret-1(RNAi) embryos (right) are shown. The time of image acquisition in seconds relative to anaphase onset is beneath the center of each image pair. Bars, 10 μm. (C) Higher magnification (2×) view of regions of each of the cortical ER panels in B. Bar, 2 μm. (D) Schematic illustrating the transition from an interphase network of thin interconnected ER tubules to a mitotic network composed of thick tubules and ER clusters. (E) Embryos expressing GFP:SP-12 fixed in early (top) and late (bottom) mitotic prophase were stained with antibodies against GFP (left) and RET-1 (middle). A single central section from a 3D computationally deconvolved image is shown for each embryo. Arrowheads point to a region of the nuclear envelope, illustrating the relative exclusion of RET-1 compared with the lumenal marker SP-12 from this ER domain. Color overlays of GFP:SP-12 (green) and RET-1(red) and higher magnification (2.3×) views of the indicated regions (boxed) are also shown (right). Bars, 10 μm.
Figure 2.
Figure 2.
Depletion of RAB-5 results in an ER morphology defect similar to depletion of YOP-1/RET-1. (A) Salt-washed membrane vesicles isolated from X. laevis eggs were incubated in the absence (top left) or presence of GTP (top right) or in the presence of GTP and 30 μM Rho GDI (bottom left) or 10 μM Rab GDI (bottom right). Data are representative of four independent experiments for each condition. Bar, 5 μm. (B) A rooted phylogenetic tree based on a sequence comparison of selected Rab-type GTPases from S. cerevisiae, C. elegans, and Homo sapiens. Asterisks denote redundancy between RAB-8 and RAB-10 or RAB-6.1 and RAB-6.2, which must be codepleted to observe a phenotype. Lethality of the embryos produced by the dsRNA-injected mother (Emb) and/or the failure of the injected mother to produce a normal number of embryos (Ste) is indicated. (C) Spinning-disk confocal optics were used to image RAB-5–depleted embryos (rab-5[RNAi]; n = 21) expressing the ER marker GFP:SP-12, as in Fig. 1 B. Bar, 10 μm. Higher magnification (2×) views of a portion of the adjacent cortical sections are shown to the right. Bar, 5 μm. (D) Metaphase control (left) and rab-5(RNAi) (right) embryos were fixed and stained with antibodies to the endosome marker RAB-5 (top) and the Golgi marker SQV-8 (bottom). Images are projections of deconvolved 3D datasets. Bar, 10 μm. (E) The number of mitotic ER clusters (>0.5 μm in diameter) measured in a cortical section of embryos expressing GFP:SP-12 collected 10 s before anaphase onset is plotted for at least 16 embryos for each condition. (F) Representative cortical sections used for the quantification in E showing GFP:SP-12 in control (left), RAB-5–depleted (middle), and YOP-1– and RET-1–depleted (right) embryos 10 s before anaphase onset. Bar, 10 μm.
Figure 3.
Figure 3.
RAB-5 structures the ER independently of known effectors. (A) Spinning-disk confocal optics were used to image GFP:SP-12–expressing rabx-5(tm1512) mutant embryos depleted of RME-6 by RNAi (rabx-5[tm1512], rme-6[RNAi]; n = 7), as in Fig. 1 B. Bar, 10 μm. Higher magnification (2×) views of a portion of the adjacent cortical sections are shown to the right. Bar, 5 μm. (B) Differential interference contrast and spinning-disk confocal optics were used to image GFP:SP-12–expressing control (n = 18), yop-1, ret-1(RNAi) (n = 13), rab-5(RNAi) (n = 21), and chc-1(RNAi) (n = 15) embryos. Representative differential interference contrast (left) and GFP:SP-12 fluorescence images (right) of a single central section are shown. Bar, 10 μm. (C) Mitotic control (top) and chc-1(RNAi) (bottom) embryos were fixed and stained with antibodies to RAB-5. Images are projections of deconvolved 3D datasets. Bar, 10 μm. (D) A table listing the two known C. elegans RAB-5 GEFs (pink; Sato et al., 2005) and the C. elegans homologues of RAB-5 effectors (purple; Deneka et al., 2003) and their human homologues. In cases where a mutant allele was available, time-lapse sequences of living embryos from the mutant strain acquired using differential interference contrast microscopy (n = 6 for each condition) were analyzed for the appearance of four nuclei after the first embryonic cytokinesis, a phenotype indicative of a defect in ER structure (for details, see Fig. 5). The four-nuclei phenotype was observed when both RAB-5 GEFs were simultaneously inhibited but not in mutants for any RAB-5 effector. (E) The number of mitotic ER clusters (>0.5 μm in diameter) measured in a cortical section of embryos expressing GFP:SP-12 collected 10 s before anaphase onset is plotted for at least six embryos for each condition.
Figure 4.
Figure 4.
Activated RAB-5 potentiates the formation of mitotic ER clusters. (A) An anti–RAB-5 immunoblot of a serially diluted extract prepared from embryos stably expressing RAB-5Q78L fused to RFPmCherry. (B) Metaphase control (left) and RFP:RAB-5Q78L–expressing (right) embryos were fixed and stained with antibodies to RAB-5. Projections of deconvolved 3D datasets are shown. Bar, 10 μm. (C) Embryos expressing GFP:SP-12 alone (n = 18), GFP:SP-12 and RFP:RAB-5Q78L (n = 15), or GFP:SP-12 and RFP:RAB-5Q78L that were also depleted of YOP-1 and RET-1 by RNAi (n = 11) were imaged using spinning-disk confocal optics. Representative images of a central plane are shown. Bar, 10 μm. (D) Embryos expressing GFP:SP-12 that were depleted of YOP-1 and RET-1 (n = 13); RAB-5 (n = 21); or YOP-1, RET-1, and RAB-5 (n = 10) were imaged by spinning-disc confocal microscopy. Representative images of a single central section are shown. Bar, 10 μm. (E) Higher magnification (2×) views of a portion of the images in D. Arrowheads highlight aberrant ER loops present during interphase and mitosis in the triple-depleted embryos. Bar, 5 μm.
Figure 5.
Figure 5.
RAB-5 and YOP-1/RET-1 promote nuclear envelope disassembly during mitosis. (A) Schematics highlighting the dynamics of the oocyte- and sperm-derived pronuclear envelopes (green) during the first division of the C. elegans embryo. (B) Spinning-disk confocal optics were used to image control (n = 8), rab-5(RNAi) (n = 16), and yop-1, ret-1(RNAi) (n = 12) embryos expressing GFP:SP-12. A representative central section immediately after the first embryonic cytokinesis is shown. Bar, 10 μm. (C–F) Spinning-disk confocal optics were used to image control (n = 9), rab-5(RNAi) (n = 11), yop-1, ret-1(RNAi) (n = 10), and npp-12(RNAi) (n = 10) embryos coexpressing RFP:histone and a GFP fusion with the resident INM protein LEM-2. Representative central sections are shown. Times are in seconds relative to anaphase onset. Schematics summarize nuclear envelope dynamics under each condition. Bars, 5 μm. (G) Representative central sections of npp-12(RNAi) embryos expressing GFP:SP-12 during metaphase and telophase. Bar, 10 μm. (H) A representative cortical section of an npp-12(RNAi) embryo expressing GFP:SP-12 10 s before anaphase onset (left). Bar, 10 μm. Mitotic ER clusters were quantified as in Fig. 3 E (right).
Figure 6.
Figure 6.
RAB-5 depletion delays nuclear envelope permeabilization, nuclear pore removal, and lamina disassembly. (A) Time-lapse spinning-disk confocal sequences of control, rab-5(RNAi), and npp-12(RNAi) embryos expressing GFP:histone were used to measure the timing of nuclear envelope breakdown relative to chromosome condensation. Representative sequences of individual nuclei are shown. Times are with respect to condensation onset. Bar, 5 μm. (B) Plot of the mean value of the condensation parameter versus time for control (gray circles; n = 5), rab-5(RNAi) (red squares; n = 5), and npp-12(RNAi) (green diamonds; n = 5) embryos. Traces are displayed with the onset of condensation as t = 0. Arrows mark the timing of nuclear envelope permeabilization for each dataset. Error bars indicate SEM. (C and D) Time-lapse sequences of control and rab-5(RNAi) embryos expressing RFP:histone and either GFP:NUP-155 (C) or YFP:LMN-1 (D) were acquired using spinning-disk confocal optics (n = 5 for each condition). Images from representative sequences are shown for control (left) and rab-5(RNAi) (right) embryos. Times are in seconds relative to the onset of chromosome segregation. Bar, 5 μm. (E) The total fluorescence intensity of nuclear LMN-1 was measured at each time point for control (n = 7), rab-5(RNAi) (n = 6), and npp-12(RNAi) (n = 6) embryos. The mean value for this measurement is plotted versus time. Error bars indicate SEM. Sequences were time aligned with respect to onset of anaphase chromosome segregation.
Figure 7.
Figure 7.
Depletion of RAB-5 prevents the mitotic redistribution of INM proteins. (A) Mitotic control (top) and spd-5(RNAi) (bottom) embryos were fixed and stained for DNA (red) and microtubules (green). Projections of deconvolved 3D datasets are shown. Centrosomes are absent in spd-5(RNAi) embryos; schematics to the right illustrate the organization of the microtubule cytoskeleton under both conditions. Bar, 10 μm. (B) Embryos expressing GFP:SP-12 were imaged using spinning-disk confocal microscopy after depletion of SPD-5 alone (n = 7) or both SPD-5 and RAB-5 (n = 6). Representative central plane images of mitotic embryos are shown. Bar, 10 μm. Higher magnification (2×) panels are shown on the right. Bar, 5 μm. (C–E) Time-lapse sequences of embryos coexpressing RFP:histone and GFP:LEM-2 depleted of SPD-5 alone (C), SPD-5 and RAB-5 (D), or SPD-5 and NPP-12 (E) were acquired using spinning-disk confocal optics (n = 5 for each condition). Selected images from representative sequences are shown. Sequences were aligned based on the timing of chromosome decondensation (0 s). Bars, 5 μm.
Figure 8.
Figure 8.
A model for the role of RAB-5 in ER structure. (A) In this model, RAB-5 on endosomes interacts with effectors on ER membranes in trans to promote their homotypic fusion. Tubule formation also requires YOP-1 and RET-1, integral ER membrane proteins that serve a structural role. (B) A model for the role of peripheral ER morphology in nuclear envelope breakdown. During nuclear envelope breakdown, the peripheral ER promotes nuclear envelope disassembly by acting as a sink for the diffusion of components of the INM (red) after their release from chromatin and the nuclear lamina. When ER morphology is disrupted by depletion of RAB-5 or YOP-1/ RET-1, the diffusion to the peripheral ER is inhibited and the nuclear envelope fails to fully disassemble.

Similar articles

Cited by

References

    1. Audhya, A., F. Hyndman, I.X. McLeod, A.S. Maddox, J.R. Yates III, A. Desai, and K. Oegema. 2005. A complex containing the Sm protein CAR-1 and the RNA helicase CGH-1 is required for embryonic cytokinesis in Caenorhabditis elegans. J. Cell Biol. 171:267–279. - PMC - PubMed
    1. Baumann, O., and B. Walz. 2001. Endoplasmic reticulum of animal cells and its organization into structural and functional domains. Int. Rev. Cytol. 205:149–214. - PubMed
    1. Bobinnec, Y., C. Marcaillou, X. Morin, and A. Debec. 2003. Dynamics of the endoplasmic reticulum during early development of Drosophila melanogaster. Cell Motil. Cytoskeleton. 54:217–225. - PubMed
    1. Calero, M., G.R. Whittaker, and R.N. Collins. 2001. Yop1p, the yeast homolog of the polyposis locus protein 1, interacts with Yip1p and negatively regulates cell growth. J. Biol. Chem. 276:12100–12112. - PubMed
    1. Cheeseman, I.M., S. Niessen, S. Anderson, F. Hyndman, J.R. Yates III, K. Oegema, and A. Desai. 2004. A conserved protein network controls assembly of the outer kinetochore and its ability to sustain tension. Genes Dev. 18:2255–2268. - PMC - PubMed

Publication types