. 2007 Jul 3;104(27):11436-40.
doi: 10.1073/pnas.0611525104. Epub 2007 Jun 25.

Global patterns in bacterial diversity

Affiliations

Global patterns in bacterial diversity

Catherine A Lozupone et al. Proc Natl Acad Sci U S A. .

Abstract

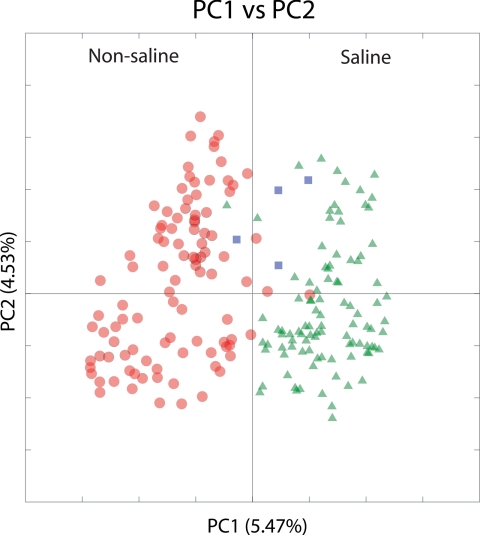
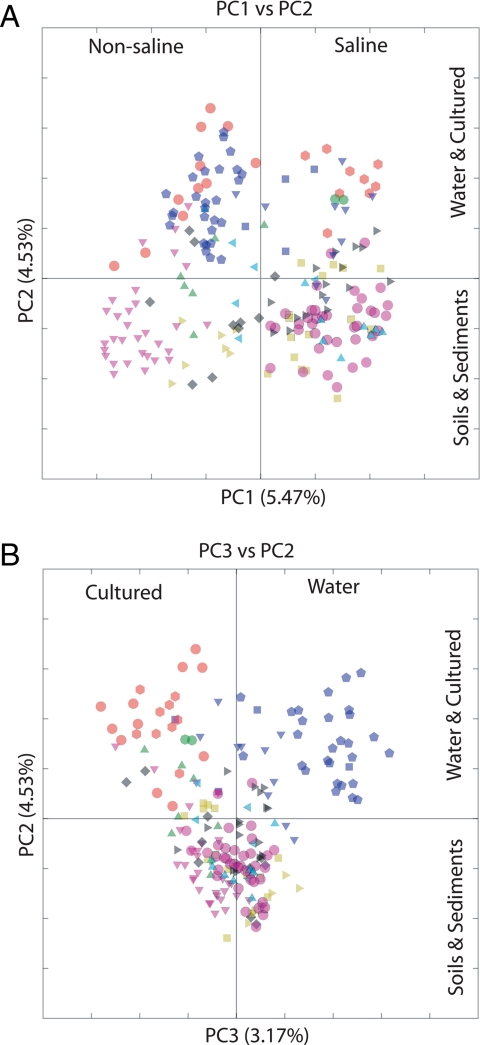
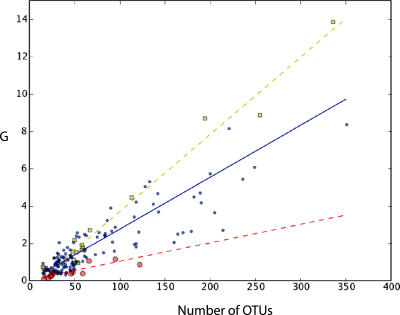
Microbes are difficult to culture. Consequently, the primary source of information about a fundamental evolutionary topic, life's diversity, is the environmental distribution of gene sequences. We report the most comprehensive analysis of the environmental distribution of bacteria to date, based on 21,752 16S rRNA sequences compiled from 111 studies of diverse physical environments. We clustered the samples based on similarities in the phylogenetic lineages that they contain and found that, surprisingly, the major environmental determinant of microbial community composition is salinity rather than extremes of temperature, pH, or other physical and chemical factors represented in our samples. We find that sediments are more phylogenetically diverse than any other environment type. Surprisingly, soil, which has high species-level diversity, has below-average phylogenetic diversity. This work provides a framework for understanding the impact of environmental factors on bacterial evolution and for the direction of future sequencing efforts to discover new lineages.


Conflict of interest statement

The authors declare no conflict of interest.

Figures

Fig. 1.
Fig. 1.
Results of PCoA colored by salinity. Results of PCoA with a UniFrac distance matrix comparing the 202 samples summarized in Table 1 and SI Data Set 1. The scatterplot is of principal coordinate 1 (PC1) vs. principal coordinate 2 (PC2). The symbols are as described in Table 1: red circles indicate nonsaline environments, green triangles indicate saline environments, and blue squares indicate mixed environments. The percentage of the variation in the samples described by the plotted principal coordinates is indicated on the axes.
Fig. 2.
Fig. 2.
Results of PCoA colored by environment type. A scatterplot of PC1 vs. PC2 (A) and PC3 vs. PC2 (B). The symbols represent the 202 samples and are as described in Table 1. A file of this scatterplot in which pop-up windows indicate which point corresponds to which sample name is available; see SI Text.
Fig. 3.
Fig. 3.
Unique diversity (G) regression analysis. Plot of the amount of branch length that is added to the phylogenetic tree (G value) by each of the 202 samples, vs. the number of OTUs that represents each sample. The main regression line is shown in blue. Bacteria that were cultured from nonsaline environments (pink circles) generally fell below the main regression line (i.e., they had negative residuals for G), thus contributing less unique diversity. Samples in the saline–misc group (yellow squares) generally fell above the main regression line (i.e., they had positive residuals for G), thus contributing more unique diversity.

References

    1. Hugenholtz P, Goebel BM, Pace NR. J Bacteriol. 1998;180:4765–4774. - PMC - PubMed
    1. Rappe MS, Giovannoni SJ. Annu Rev Microbiol. 2003;57:369–394. - PubMed
    1. Schloss PD, Handelsman J. Microbiol Mol Biol Rev. 2004;68:686–691. - PMC - PubMed
    1. Pace NR. Science. 1997;276:734–740. - PubMed
    1. Widmann J, Hamady M, Knight R. Mol Cell Proteomics. 2006;5:1520–1532. - PubMed

Publication types