Dual personality of GABA/glycine-mediated depolarizations in immature spinal cord
- PMID: 17592145
- PMCID: PMC2040923
- DOI: 10.1073/pnas.0704832104
Dual personality of GABA/glycine-mediated depolarizations in immature spinal cord
Abstract
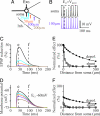
The inhibitory action of glycine and GABA in adult neurons consists of both shunting incoming excitations and moving the membrane potential away from the action potential (AP) threshold. By contrast, in immature neurons, inhibitory postsynaptic potentials (IPSPs) are depolarizing; it is generally accepted that, despite their depolarizing action, these IPSPs are inhibitory because of the shunting action of the Cl(-) conductance increase. Here we investigated the integration of depolarizing IPSPs (dIPSPs) with excitatory inputs in the neonatal rodent spinal cord by means of both intracellular recordings from lumbar motoneurons and a simulation using the compartment model program "Neuron." We show that the ability of IPSPs to suppress suprathreshold excitatory events depends on E(Cl) and the location of inhibitory synapses. The depolarization outlasts the conductance changes and spreads electrotonically in the somatodendritic tree, whereas the shunting effect is restricted and local. As a consequence, dIPSPs facilitated AP generation by subthreshold excitatory events in the late phase of the response. The window of facilitation became wider as E(Cl) was more depolarized and started earlier as inhibitory synapses were moved away from the excitatory input. GAD65/67 immunohistochemistry demonstrated the existence of distal inhibitory synapses on motoneurons in the neonatal rodent spinal cord. This study demonstrates that small dIPSPs can either inhibit or facilitate excitatory inputs depending on timing and location. Our results raise the possibility that inhibitory synapses exert a facilitatory action on distant excitatory inputs and slight changes of E(Cl) may have important consequences for network processing.
Conflict of interest statement
The authors declare no conflict of interest.
Figures


Similar articles
-
Glucose is an adequate energy substrate for the depolarizing action of GABA and glycine in the neonatal rat spinal cord in vitro.J Neurophysiol. 2012 Jun;107(11):3107-15. doi: 10.1152/jn.00571.2011. Epub 2012 Mar 28. J Neurophysiol. 2012. PMID: 22457452
-
Inhibitory postsynaptic potentials in lumbar motoneurons remain depolarizing after neonatal spinal cord transection in the rat.J Neurophysiol. 2006 Nov;96(5):2274-81. doi: 10.1152/jn.00328.2006. Epub 2006 Jun 28. J Neurophysiol. 2006. PMID: 16807348
-
Synaptic activation of bulbospongiosus motoneurons via dorsal gray commissural inputs.J Neurophysiol. 2013 Jan;109(1):58-67. doi: 10.1152/jn.00752.2012. Epub 2012 Oct 17. J Neurophysiol. 2013. PMID: 23076107
-
Chapter 1--importance of chloride homeostasis in the operation of rhythmic motor networks.Prog Brain Res. 2011;188:3-14. doi: 10.1016/B978-0-444-53825-3.00006-1. Prog Brain Res. 2011. PMID: 21333799 Review.
-
Physiological functions of GABA-induced depolarizations in the developing rat spinal cord.Perspect Dev Neurobiol. 1998;5(2-3):279-87. Perspect Dev Neurobiol. 1998. PMID: 9777643 Review.
Cited by
-
Activation of 5-HT2A receptors upregulates the function of the neuronal K-Cl cotransporter KCC2.Proc Natl Acad Sci U S A. 2013 Jan 2;110(1):348-53. doi: 10.1073/pnas.1213680110. Epub 2012 Dec 17. Proc Natl Acad Sci U S A. 2013. PMID: 23248270 Free PMC article.
-
GABA depolarizes immature neurons and inhibits network activity in the neonatal neocortex in vivo.Nat Commun. 2015 Jul 16;6:7750. doi: 10.1038/ncomms8750. Nat Commun. 2015. PMID: 26177896
-
The "mirror" estimate: an intuitive predictor of membrane polarization during extracellular stimulation.Biophys J. 2009 May 6;96(9):3495-508. doi: 10.1016/j.bpj.2008.12.3961. Biophys J. 2009. PMID: 19413956 Free PMC article.
-
Using imaging and genetics in zebrafish to study developing spinal circuits in vivo.Dev Neurobiol. 2008 May;68(6):817-34. doi: 10.1002/dneu.20617. Dev Neurobiol. 2008. PMID: 18383546 Free PMC article. Review.
-
Contribution of the potassium-chloride cotransporter KCC2 to the strength of inhibition in the neonatal rodent spinal cord in vitro.J Neurosci. 2015 Apr 1;35(13):5307-16. doi: 10.1523/JNEUROSCI.1674-14.2015. J Neurosci. 2015. PMID: 25834055 Free PMC article.
References
Publication types
MeSH terms
Substances
Grants and funding
LinkOut - more resources
Full Text Sources
Research Materials

