. 2007 Jun 25:8:34.
doi: 10.1186/1471-2156-8-34.

Human population structure detection via multilocus genotype clustering

Affiliations

Human population structure detection via multilocus genotype clustering

Xiaoyi Gao et al. BMC Genet. .

Abstract

Background: We describe a hierarchical clustering algorithm for using Single Nucleotide Polymorphism (SNP) genetic data to assign individuals to populations. The method does not assume Hardy-Weinberg equilibrium and linkage equilibrium among loci in sample population individuals.

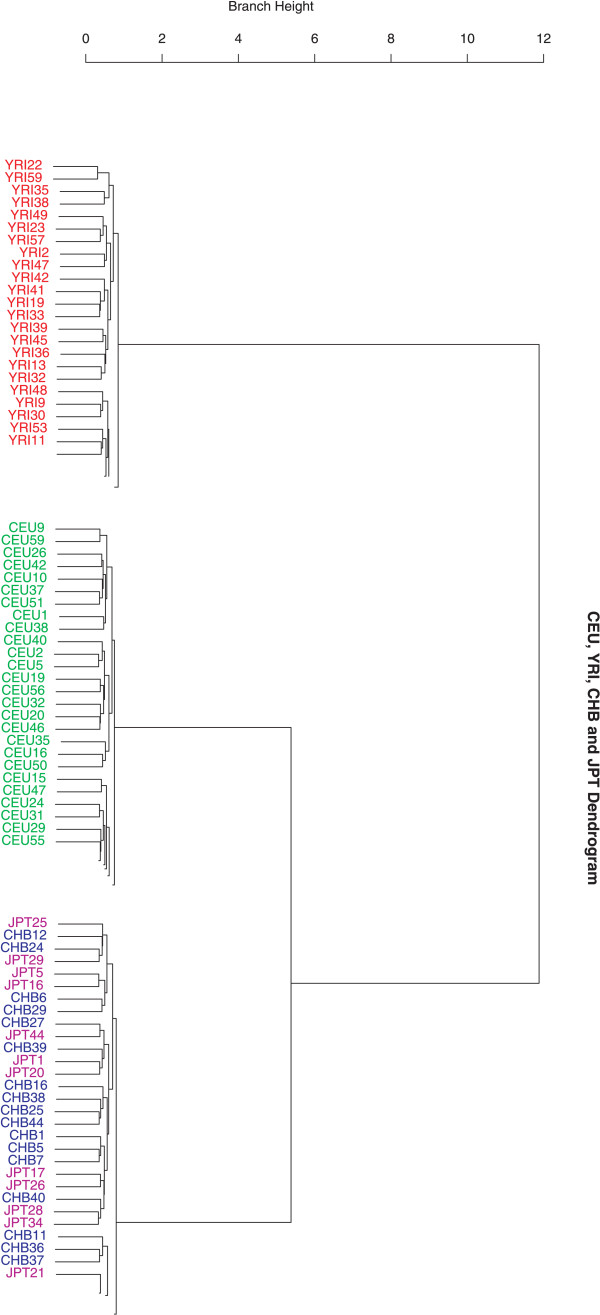
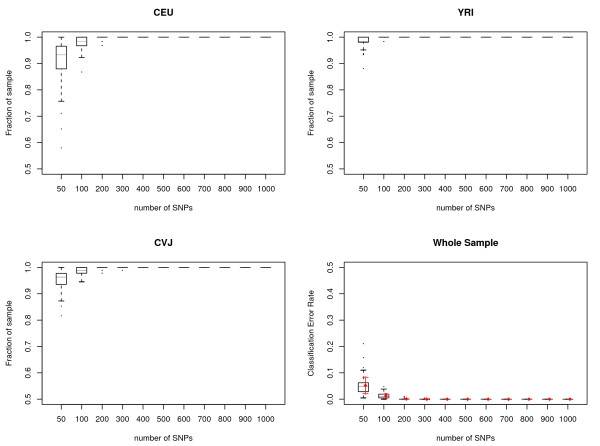
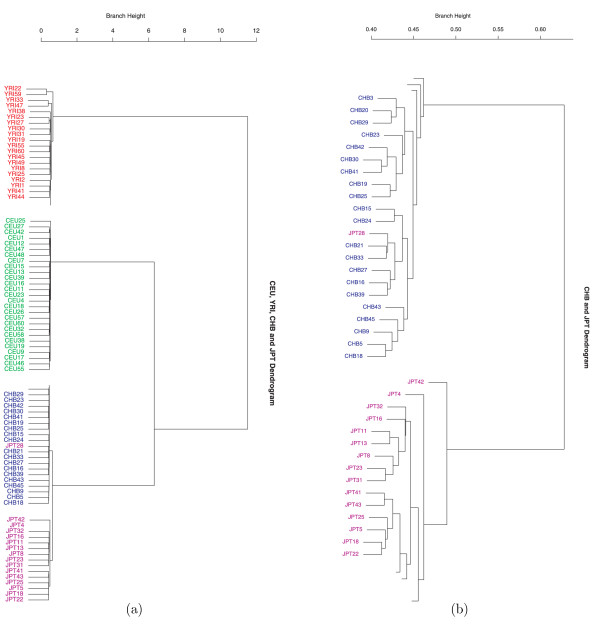
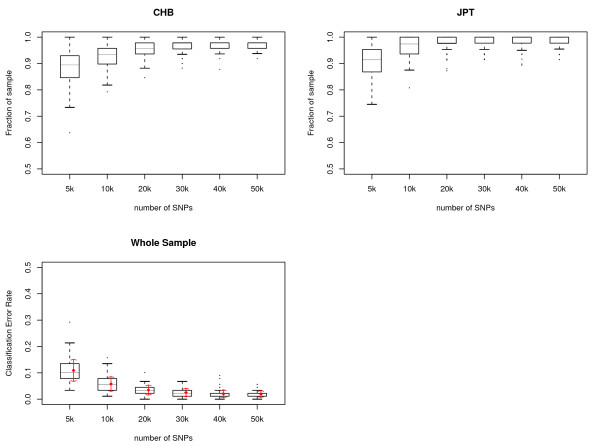
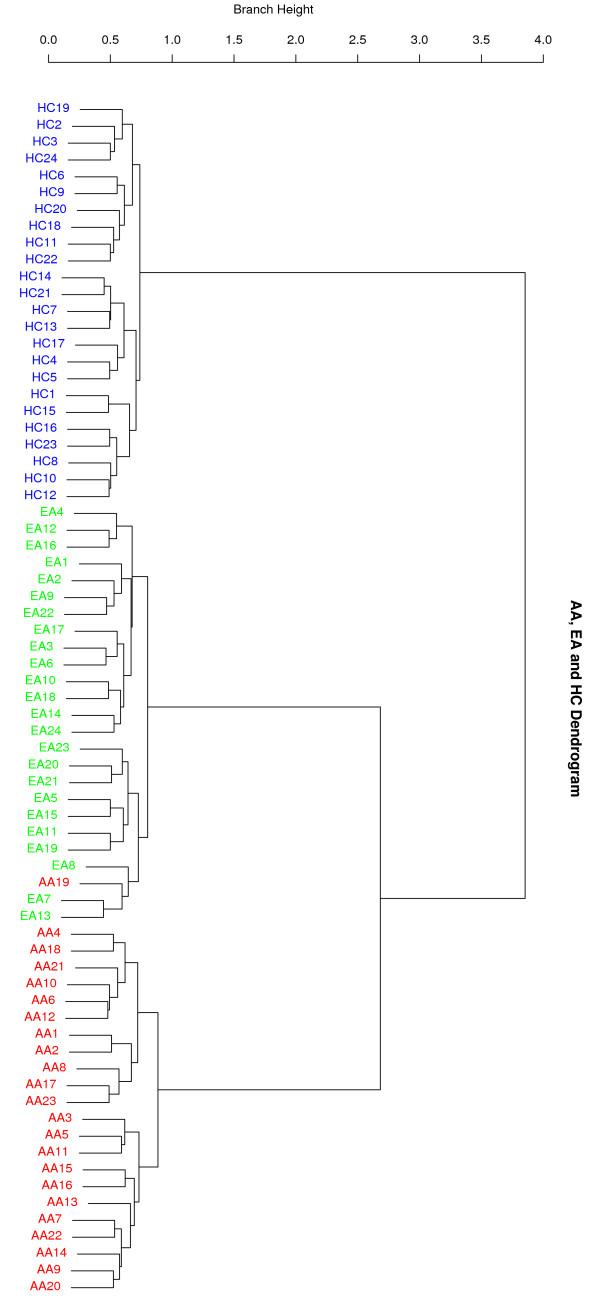
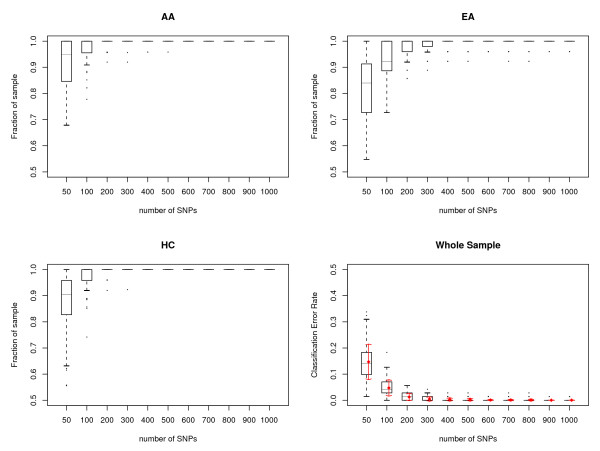
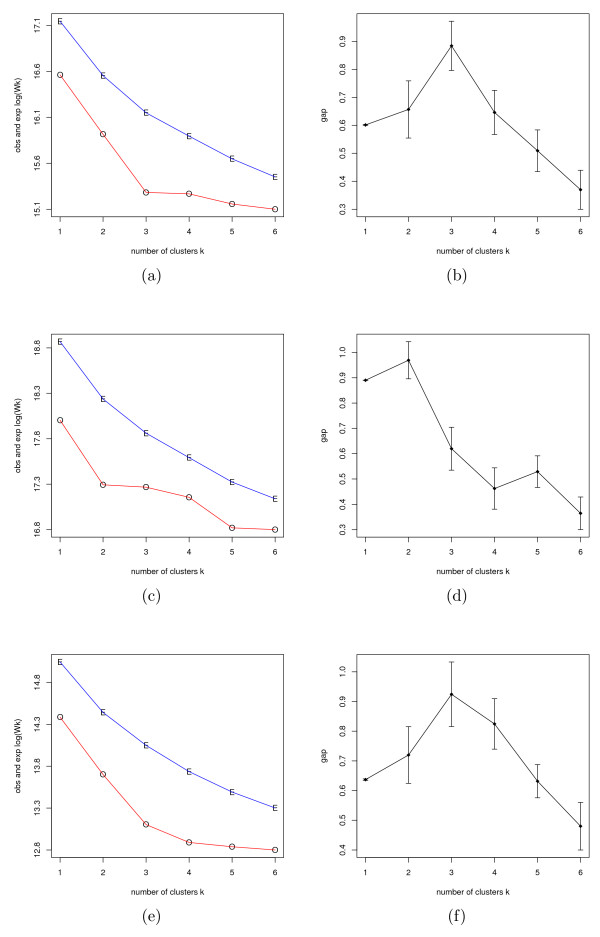
Results: We show that the algorithm can assign sample individuals highly accurately to their corresponding ethnic groups in our tests using HapMap SNP data and it is also robust to admixed populations when tested with Perlegen SNP data. Moreover, it can detect fine-scale population structure as subtle as that between Chinese and Japanese by using genome-wide high-diversity SNP loci.

Conclusion: The algorithm provides an alternative approach to the popular STRUCTURE program, especially for fine-scale population structure detection in genome-wide association studies. This is the first successful separation of Chinese and Japanese samples using random SNP loci with high statistical support.


Figures

Figure 1
Figure 1
A hierarchical cluster for the HapMap data with a sample of 200 SNPs. A total of 209 unrelated individuals from four populations are shown: CEU (60), YRI (60) and CHB (45) + JPT (44). This figure shows a clustering result using 200 genome-wide random autosomal SNP loci. It is evident that YRI, CEU and CHB+JPT form three distinct clusters. Branch height represents dissimilarity. This figure shows the partial cluster, for the full image please see additional file 1.
Figure 2
Figure 2
The number of random SNP loci needed to correctly classify individuals in the HapMap data. Boxplots show the statistics of predicted origin vs. known origin for CEU, YRI and CHB+JPT (CVJ) estimated with different numbers of SNP loci. Each dendrogram tree was cut at depth 2 to generate three clusters and predicted origin was assigned by the major population group represented in the cluster. Each number of SNPs was randomly sampled 100 times from 22 autosomal chromosomes. Horizontal lines are drawn at the 1st quartile, 3rd quartile and median and are connected to form the box. A vertical dashed line is drawn down from the 1st quartile to the most extreme data point within a distance of 1.5 interquartile range (IQR). A similar line is drawn up from the 3rd quartile. The ends of the vertical lines are indicated by short horizontal lines. Outliers are marked by dots. Red diamonds are the means of the classification error rate for the pooled whole sample for each number of SNP loci tested and red arrows are mean ± standard deviation.
Figure 3
Figure 3
Hierarchical clusters for the HapMap data with a sample of 20K SNPs. (a) A total of 209 unrelated individuals from four populations are shown: CEU (60), YRI (60), CHB (45) and JPT (44). This figure shows a clustering result using 20K genome-wide random autosomal SNP loci. It is evident that YRI, CEU, CHB and JPT form four distinct clusters except for the misclassification of JPT28. Branch height represents dissimilarity. Notice that compared with YRI and CEU branch height, the CHB and JPT branch height is much shorter, representing that the genetic distance between these two populations is relatively close. This figure shows the partial cluster, for the full image please see additional file 2. (b) The magnified figure of CHB and JPT clusters in (a). This figure shows the partial cluster, for the full image please see additional file 3.
Figure 4
Figure 4
The number of random SNP loci needed to correctly classify CHB and JPT from the HapMap data. Boxplots show the statistics of predicted origin vs. known origin for CHB and JPT estimated with different numbers of SNP loci. Each number of SNPs was randomly sampled 100 times from 22 autosomal chromosomes. Horizontal lines are drawn at the 1st quartile, 3rd quartile and median and are connected to form the box. A vertical dashed line is drawn down from the 1st quartile to the most extreme data point within a distance of 1.5 interquartile range (IQR). A similar line is drawn up from the 3rd quartile. The ends of the vertical lines are indicated by short horizontal lines. Outliers are marked by dots. Red diamonds are the means of the classification error rate for the whole sample for each number of SNP loci tested and red arrows are mean ± standard deviation.
Figure 5
Figure 5
A hierarchical cluster for the Perlegen data with a sample of 200 SNPs. A total of 71 unrelated individuals from three populations are shown: AA (23), EA (24) and HC (24). This figure shows a clustering result using 200 genome-wide random autosomal SNP loci. It is evident that AA, EA and HC form three distinct clusters except for the misclassification of AA19. Branch height represents dissimilarity.
Figure 6
Figure 6
The number of random SNP loci needed to correctly classify individuals in the Perlegen data. Boxplots show the statistics of predicted origin vs. known origin for AA, EA and HC estimated with different numbers of SNP loci. Each dendrogram tree was cut at depth 2 to generate three clusters and predicted origin was assigned by the major population group represented in the cluster. For each number of SNPs, we randomly sampled 100 times from 22 autosomal chromosomes. Horizontal lines are drawn at the 1st quartile, 3rd quartile and median and are connected to form the box. A vertical dashed line is drawn down from the 1st quartile to the most extreme data point within a distance of 1.5 interquartile range (IQR). A similar line is drawn up from the 3rd quartile. The ends of the vertical lines are indicated by short horizontal lines. Outliers are marked by dots. Red diamonds are the means of the classification error rate for the sample for each number of SNP loci tested and red arrows are mean ± standard deviation.
Figure 7
Figure 7
Plots of the gap statistic. The correct number of populations, K, was estimated via the gap statistic. In the left panel, the blue and red curves are the estimated expectation of log (Wk) and the observed log (Wk), respectively. The right panel is the gap statistic plot. The number of populations is set to range from 1 to 6. (a) and (b) correspond to the HapMap data, using 1,000 random genome-wide SNP loci. (c) and (d) correspond to the CHB and JPT data, using 30,000 random genome-wide SNP loci. (e) and (f) correspond to the Perlegen data, using 1,000 random genome-wide SNP loci. The inferred optimal K is the elbow point in the left panel, which is indicated by the maximizing gap on the right panel. It is clear that the gap statistic gives the optimal number of populations in each scenario as 3, 2, and 3, respectively.

References

    1. Lander ES, Schork NJ. Genetic dissection of complex traits. Science. 1994;265:2037–2048. doi: 10.1126/science.8091226. - DOI - PubMed
    1. Risch NJ. Searching for genetic determinants in the new millennium. Nature. 2000;405:847–856. doi: 10.1038/35015718. - DOI - PubMed
    1. Marchini J, Cardon L, Phillips M, Donnelly P. The effects of human population structure on large genetic association studies. Nat Genet. 2004;36:512–517. doi: 10.1038/ng1337. - DOI - PubMed
    1. Freedman M, Reich D, Penney K, McDonald G, Mignault A, Patterson N, Gabriel S, Topol E, Smoller J, Pato C, Pato M, Petryshen T, Kolonel L, Lander E, Sklar P, Henderson B, Hirschhorn J, Altshuler D. Assessing the impact of population stratification on genetic association studies. Nat Genet. 2004;36:388–393. doi: 10.1038/ng1333. - DOI - PubMed
    1. Cavalli-Sforza LL, Menozzi P, Piazza A. In: The history and geography of human genes. Princeton, NJ, editor. Princeton University Press; 1994.

Publication types

Substances

LinkOut - more resources