

Magnitude, mechanism, and reproducibility of QT interval differences between superimposed global and individual lead ECG complexes
- PMID: 17593183
- PMCID: PMC6931960
- DOI: 10.1111/j.1542-474X.2007.00153.x
Magnitude, mechanism, and reproducibility of QT interval differences between superimposed global and individual lead ECG complexes
Abstract
Background: The global QT interval, emerging as a standard measurement provided by digital electrocardiographs, is defined by the earliest QRS onset and latest T-wave offset that occur in any of the standard leads. Differences between global ECG measurements and those from individual ECG leads have implications for the redefinition of normal values, for recognition of disease, and for drug safety. This study sought to quantify the differences between global QT intervals measured from 12 superimposed ECG leads with QT intervals and from single lead complexes, to examine the separate effects of QRS onset and T-wave offset on these differences, and to examine the reproducibility of these measurements.
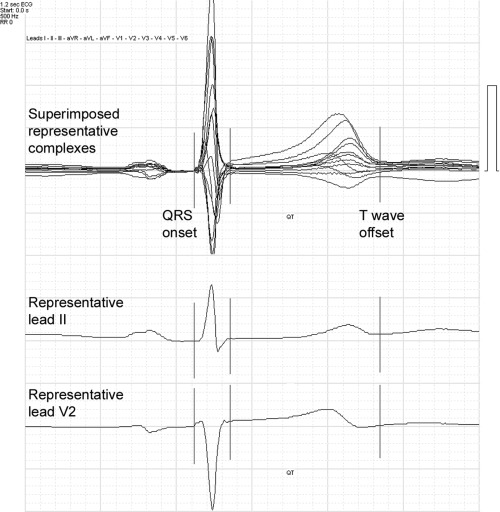
Methods: QTo intervals (Q onset to T offset) from 50 digitized ECGs sampled at 500 Hz were examined by computer assisted derivation of representative complexes from standard leads II, V(2), and V(3), by both baseline and tangent methods. Global QTo intervals were measured from superimposition of the representative complexes of all 12 leads. A time-coherent matrix of waveform onset and offset points allowed direct comparison of the components of the differences.
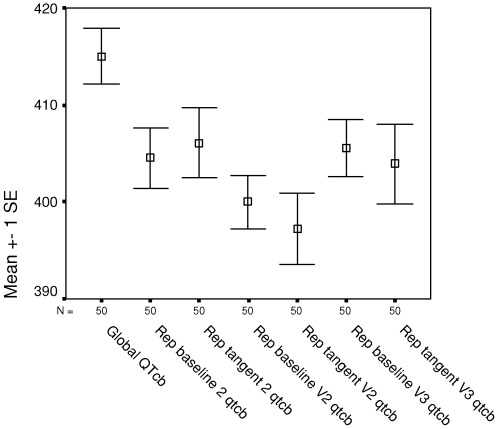
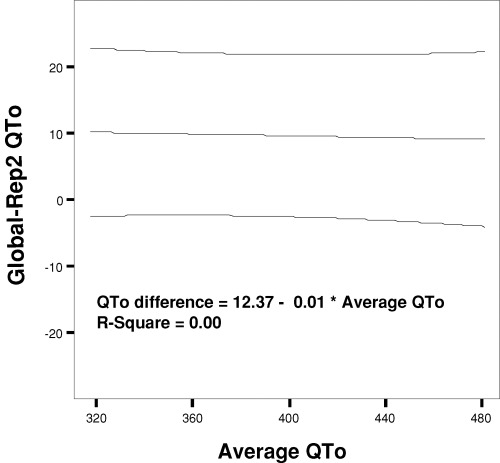
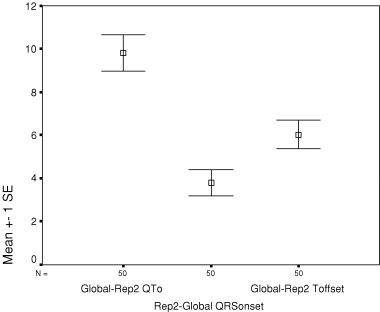
Results: Global QTo and Bazett-adjusted global QTc were greater than each of the baseline and tangent measurements in representative leads II, V(2), and V(3), with mean differences ranging from 8 to 18 ms. QRS onset was earlier in the global complex than in each of the representative leads, with mean differences of 3-5 ms, whereas T-wave offset was significantly later in the global complex than in each of the representative leads, with mean differences of 5-11 ms. Remeasurement of all ECGs after an interval of 6 months confirmed the relative magnitudes of the global and individual lead QTo durations and small mean differences between pairs (-0.9 to 2.7 ms). Although global QTo had the largest mean difference (only 2.7 ms), it had the smallest standard deviation of the mean difference and lowest coefficient of variability (1.58%) of all measurements.
Conclusion: Global QT measurements are systematically larger than measurements from representative complexes of individual leads. These differences result from the combined effects of earlier QRS onset and later T-wave offset in the global complex, with T-wave offset the more dominant component of the difference.
Figures
References
-
- Willems JL, Arnaud P, Van Bemmel JH, et al Assessment of the performance of electrocardiographic computer programs with the use of a reference data base. Circulation 1985;71:523–534. - PubMed
-
- Willems JL, Zywietz C, Arnaud P, et al Influence of noise on wave boundary recognition by ECG measurement programs. Recommendations for preprocessing. Comput Biomed Res 1987;20:543–562. - PubMed
-
- Kors JA, Van Herpen G, Van Bemmel JH. Variability in ECG computer interpretation. Analysis of individual complexes vs analysis of a representative complex. J Electrocardiol 1992;25:263–271. - PubMed
-
- Savelieva I, Yi G, Guo X, et al Agreement and reproducibility of automatic versus manual measurement of QT interval and QT dispersion. Am J Cardiol 1998;81:471–477. - PubMed
-
- Warner RA, Hill NE. Using digital versus analog ECG data in clinical trials. J Electrocardiol 1999;32(Suppl):103–107. - PubMed
MeSH terms
LinkOut - more resources
Full Text Sources
Medical
