Comparative Study
. 2007:3:121.
doi: 10.1038/msb4100155. Epub 2007 Jun 26.

A genome-scale metabolic reconstruction for Escherichia coli K-12 MG1655 that accounts for 1260 ORFs and thermodynamic information

Affiliations
Comparative Study

A genome-scale metabolic reconstruction for Escherichia coli K-12 MG1655 that accounts for 1260 ORFs and thermodynamic information

Adam M Feist et al. Mol Syst Biol. 2007.

Abstract

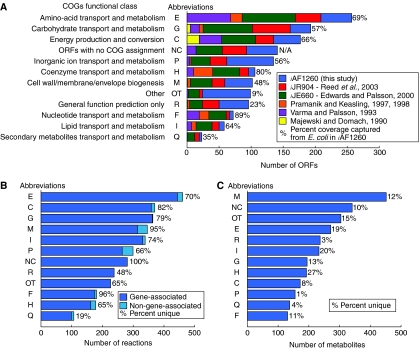
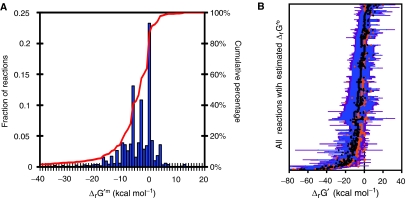
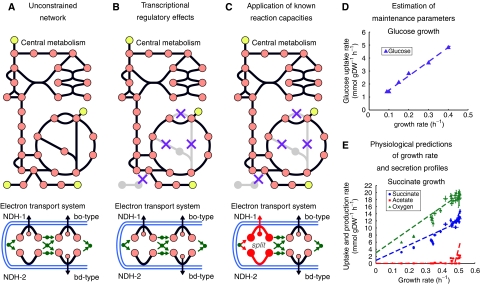
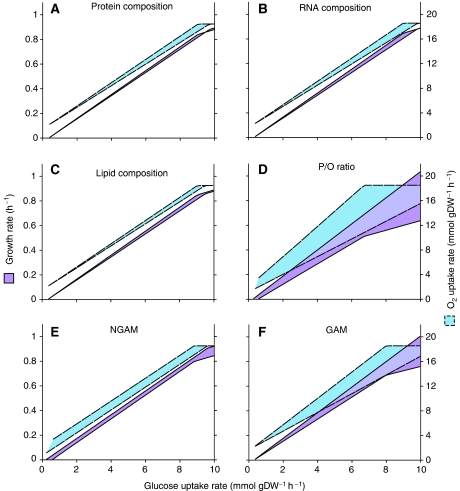
An updated genome-scale reconstruction of the metabolic network in Escherichia coli K-12 MG1655 is presented. This updated metabolic reconstruction includes: (1) an alignment with the latest genome annotation and the metabolic content of EcoCyc leading to the inclusion of the activities of 1260 ORFs, (2) characterization and quantification of the biomass components and maintenance requirements associated with growth of E. coli and (3) thermodynamic information for the included chemical reactions. The conversion of this metabolic network reconstruction into an in silico model is detailed. A new step in the metabolic reconstruction process, termed thermodynamic consistency analysis, is introduced, in which reactions were checked for consistency with thermodynamic reversibility estimates. Applications demonstrating the capabilities of the genome-scale metabolic model to predict high-throughput experimental growth and gene deletion phenotypic screens are presented. The increased scope and computational capability using this new reconstruction is expected to broaden the spectrum of both basic biology and applied systems biology studies of E. coli metabolism.


Figures

Figure 1
Figure 1
Classification of the ORFs, reactions and metabolites included in iAF1260. (A) Coverage of characterized ORFs from each of the COGs functional classes included in iAF1260 and five previous reconstructions. The percentage given is the total coverage accounted for in iAF1260 for each class. Some ORFs included in the reconstructions did not have a COG functional class assignment (see Supplemental information). (B) The number of reactions (both gene-associated and non-gene associated) that are associated to ORFs from each COG functional class. Since ORFs can belong to multiple classes, the percent unique in each class is listed. Non-gene-associated reactions were assigned to a class manually. (C) The number of metabolites that participate in reactions from each functional class and the percent unique in each class. Other (OT) includes classes J, K, L, O, T, U, V (see Supplementary information). NC, no COG assignment.
Figure 2
Figure 2
Thermodynamic properties of the reactions in iAF1260. (A) The distribution of estimated ΔrG′m values for the reactions in iAF1260. ΔrG′m could be estimated for 1996 reactions (96%) in the reconstruction. 64% of the represented reactions have a negative ΔrG′m, and 20% of the reactions have a ΔrG′m of approximately zero. This distribution of ΔrG′m values indicates that most reactions in the model are thermodynamically favorable at millimolar concentration conditions. (B) The range of possible ΔrG′ values for the reactions in iAF1260. ΔrG′ differs from ΔrG′o (orange diamonds) and ΔrG′m (black diamonds) due to variations in metabolite concentrations from the 1 M and 1 mM reference states, respectively. Metabolite concentrations typically range from 0.02 to 0.00001 M, resulting in a wide range of values for ΔrG′ (blue error bars). Taking uncertainty into account, the range of possible values for ΔrG′ can be extended (purple error bars). The ΔrG′ ranges were used to assess the feasibility and reversibility of the reactions in iAF1260; reactions for which a positive ΔrG′ is not possible are thermodynamically irreversible.
Figure 3
Figure 3
Utilizing iAF1260 as a predictive model. (A) A drawing of central metabolism and the ETS included in iAF1260. Originally, the entire network is unconstrained. (B) Application of transcriptional regulatory effects restricts the total number of pathways, or routes, flux can pass through in the network. (C) Further application of known reaction capacities can result in more accurate predictions. For example, the flux through the NADH dehydrogenase enzymes is split in a 1:1 ratio during a simulation to produce an optimal P/O ratio of approximately 1.4 (Gennis and Stewart, 1996; Noguchi et al, 2004). (D) The non-metabolic activity of the cell can be accounted for through maintenance parameters and these were approximated using experimental data under known media conditions. Chemostat data (see Materials and methods) was used (triangles) and the dotted line shows the modeling predictions with the appropriate maintenance parameters. (E) After the parameters are approximated, the model can then be used to predict the GR (circles), product formation (acetate, squares) and additional uptake rates (oxygen, triangles) under different environmental conditions (for succinate growth in this case).
Figure 4
Figure 4
Sensitivity analysis on the modeling parameters used in analyzing iAF1260. The relationship between the GUR (mmol gDW−1 h−1) (bottom axes, the dependant variable) and the resulting (1) GR (h−1) (left axes) and (2) OUR (mmol gDW−1 h−1) (right axes) produced during the sensitivity analysis using iAF1260. Using FBA and iAF1260, optimal growth was simulated under glucose aerobic conditions while varying (A) the dry weight percentage of protein (50–80%), (B) RNA (10–25%) and (C) lipid (7–15%) in the BOFCORE using physiologically measured values (Pramanik and Keasling, 1997). Also analyzed was (D) potential P/O ratios (1.0–2.7) in the network, as well as the (E) NGAM (±50%) and (F) GAM (±50%) that were determined for these conditions.
Figure 5
Figure 5
ORF essentiality predictions using iAF1260. This heat map characterizes the agreement between ORFs predicted to be essential using iAF1260 and those experimentally determined from Baba et al (2006) and Joyce et al (2006). The enlarged region details how each a row corresponds to a computationally predicted essential ORF (188 total). The overall agreement between iAF1260 predictions and those found to be experimentally essential (overall, column 1) is shown along with a breakdown for ORFs found to be essential under rich media conditions (rich, column 2), under both glucose and glycerol minimal media conditions (shared, column 3) and under just glucose minimal medium conditions (glucose, column 4). ORFs are further grouped by their COG functional class (see Figure 1 for abbreviations; MU-ORF belongs to multiple COG classes). Dark blue indicates the condition under which each ORF was found to be essential. For example, folP was predicted to be an essential ORF for the biosynthesis of folate in iAF1260 under these conditions, but was not identified as essential by Baba et al (2006). This suggested the possibility of an alternative pathway for this step in E. coli that has yet to be characterized.

Similar articles

Cited by

References

    1. (NC-IUBMB) NCotIUoBaMB (2006) Enzyme nomenclature. Moss, GP
    1. Albe KR, Butler MH, Wright BE (1990) Cellular concentrations of enzymes and their substrates. J Theor Biol 143: 163–195 - PubMed
    1. Alberty RA (2003) Thermodynamics of Biochemical Reactions. Massachusetts Institute of Technology: Cambridge, MA
    1. Alexander K, Young IG (1978) Alternative hydroxylases for the aerobic and anaerobic biosynthesis of ubiquinone in Escherichia coli. Biochemistry 17: 4750–4755 - PubMed
    1. Almaas E, Kovacs B, Vicsek T, Oltvai ZN, Barabasi AL (2004) Global organization of metabolic fluxes in the bacterium Escherichia coli. Nature 427: 839–843 - PubMed

Publication types