. 2007 Jun;4(6):e230.
doi: 10.1371/journal.pmed.0040230.

Canine and human visual cortex intact and responsive despite early retinal blindness from RPE65 mutation

Affiliations

Canine and human visual cortex intact and responsive despite early retinal blindness from RPE65 mutation

Geoffrey K Aguirre et al. PLoS Med. 2007 Jun.

Abstract

Background: RPE65 is an essential molecule in the retinoid-visual cycle, and RPE65 gene mutations cause the congenital human blindness known as Leber congenital amaurosis (LCA). Somatic gene therapy delivered to the retina of blind dogs with an RPE65 mutation dramatically restores retinal physiology and has sparked international interest in human treatment trials for this incurable disease. An unanswered question is how the visual cortex responds after prolonged sensory deprivation from retinal dysfunction. We therefore studied the cortex of RPE65-mutant dogs before and after retinal gene therapy. Then, we inquired whether there is visual pathway integrity and responsivity in adult humans with LCA due to RPE65 mutations (RPE65-LCA).

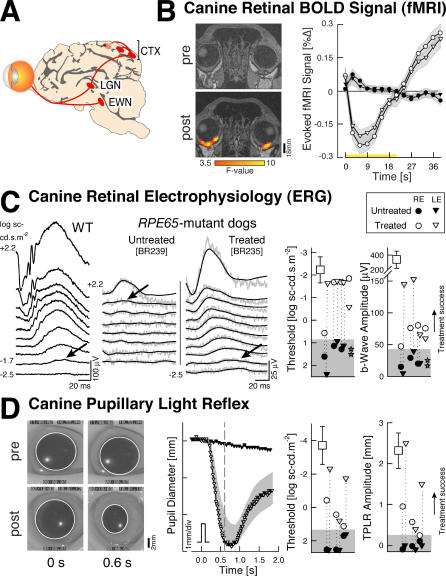
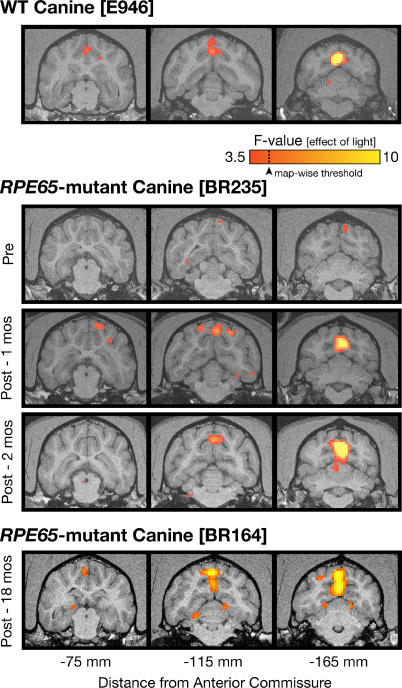
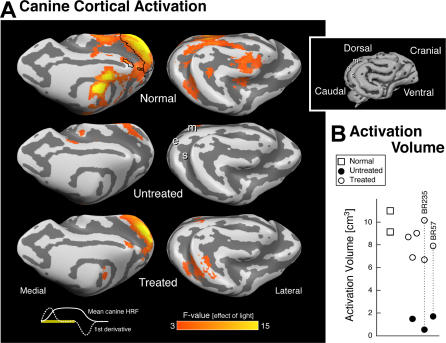
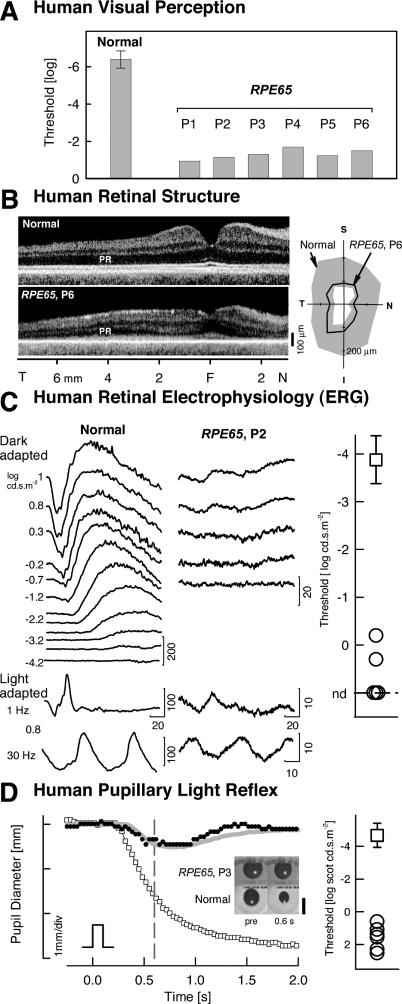
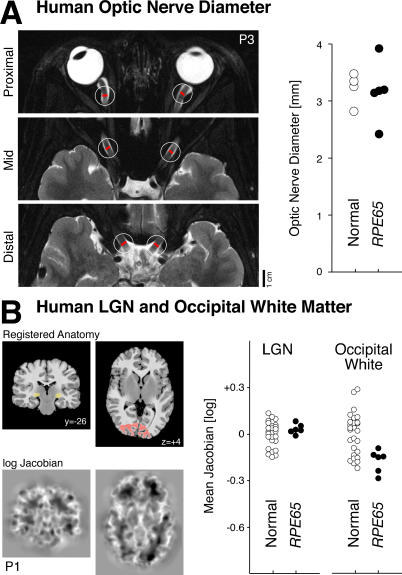
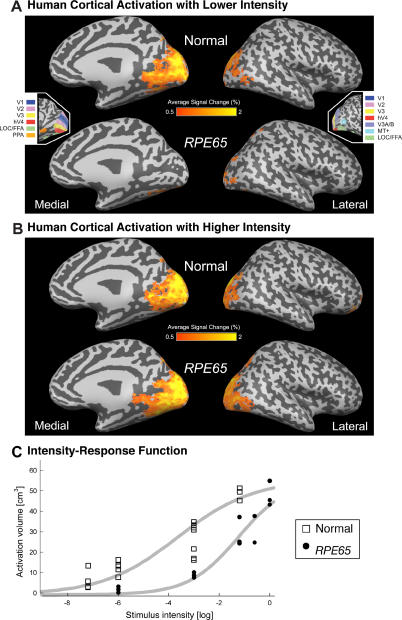
Methods and findings: RPE65-mutant dogs were studied with fMRI. Prior to therapy, retinal and subcortical responses to light were markedly diminished, and there were minimal cortical responses within the primary visual areas of the lateral gyrus (activation amplitude mean +/- standard deviation [SD] = 0.07% +/- 0.06% and volume = 1.3 +/- 0.6 cm(3)). Following therapy, retinal and subcortical response restoration was accompanied by increased amplitude (0.18% +/- 0.06%) and volume (8.2 +/- 0.8 cm(3)) of activation within the lateral gyrus (p < 0.005 for both). Cortical recovery occurred rapidly (within a month of treatment) and was persistent (as long as 2.5 y after treatment). Recovery was present even when treatment was provided as late as 1-4 y of age. Human RPE65-LCA patients (ages 18-23 y) were studied with structural magnetic resonance imaging. Optic nerve diameter (3.2 +/- 0.5 mm) was within the normal range (3.2 +/- 0.3 mm), and occipital cortical white matter density as judged by voxel-based morphometry was slightly but significantly altered (1.3 SD below control average, p = 0.005). Functional magnetic resonance imaging in human RPE65-LCA patients revealed cortical responses with a markedly diminished activation volume (8.8 +/- 1.2 cm(3)) compared to controls (29.7 +/- 8.3 cm(3), p < 0.001) when stimulated with lower intensity light. Unexpectedly, cortical response volume (41.2 +/- 11.1 cm(3)) was comparable to normal (48.8 +/- 3.1 cm(3), p = 0.2) with higher intensity light stimulation.

Conclusions: Visual cortical responses dramatically improve after retinal gene therapy in the canine model of RPE65-LCA. Human RPE65-LCA patients have preserved visual pathway anatomy and detectable cortical activation despite limited visual experience. Taken together, the results support the potential for human visual benefit from retinal therapies currently being aimed at restoring vision to the congenitally blind with genetic retinal disease.


Conflict of interest statement

Competing Interests. WWH and the University of Florida have a financial interest in the company AGTC, which might commercialize some of the technology described in this paper. A conflict of interest monitoring plan is in place at the University of Florida.

Figures

Figure 1
Figure 1. Retinal and Subcortical Responses in RPE65-Mutant Dogs Restored with Gene Therapy
(A) Visual system structures involved in the measured responses are shown: EWN, Edinger-Westphal nucleus; LGN, lateral geniculate nucleus; CTX, striate and parastriate cortex. (B) Retinal blood flow responses to visual stimulation are presented. Shown is the average BOLD fMRI response (± standard error of mean in gray) to visual stimulation obtained from the eyes of an affected animal (BR235) pre- (filled symbols) and post-treatment (unfilled symbols). After treatment, light stimulation evokes a change in blood flow within the retina, which was absent prior to therapy. The initial negative response of the signal is a consequence of the brief period of stimulation used (21 s) in the face of a very long integration time (>40 s), which has been observed in retinal hemodynamic responses [30]. On the left side are coronal slices through the eye obtained pre- (top) and post-treatment (bottom). Signal responses after treatment (thresholded F > 3.5) are seen along the posterior curvature of the globe. Signal loss from susceptibility artifact from frontal sinuses masks any responses from more anterior areas of the eye. (C) Retinal electrophysiology by ERG is shown. Left panels compare waveforms evoked by increasing intensities of light in wild-type (WT) and RPE65-mutant dogs (untreated and treated). Raw (gray) and filtered (black) waveforms are displayed for the mutant dogs. Arrows show ERG b-wave thresholds. Right panels show threshold and amplitude parameters in RPE65-mutant dogs 3 mo after treatment (unfilled symbols) compared to wild-type (squares), untreated (filled symbols), and after a subtherapeutic dose (BR239, stars) dogs (vertical dotted lines connect eyes with pre- and post-treatment evaluations; gray region defines mean + 2 SD of the ERG parameter in untreated RPE65-mutant eye). (D) Brainstem responses using the TPLR in BR164 pre- and 1 mo post-treatment (video frames show the pupil before and 0.6 s after a 0.6 log scot-cd.m−2 stimulus; pupillary margin delineated). Pupillary contraction amplitude and timing in this eye post-treatment (middle panel; unfilled triangles) was within normal limits (gray band). Threshold and amplitude parameters (right panel) show treatment success in RPE65-mutant eyes after gene therapy compared to untreated/pretreatment results.
Figure 2
Figure 2. fMRI Responses in RPE65-Mutant Dogs before and after Gene Therapy
Three coronal slices through the brain are shown, including both the lateral gyrus and extrastriate cortical areas (located within the marginal and ectomarginal sulci). Red and yellow indicate the location of significant responses to light stimulation. Top row: visual responses in a wild-type (WT) dog. Middle three rows: pre- and post-treatment data from an RPE65-mutant dog. Post-treatment data were obtained during two separate sessions separated by 1 mo and continue to show WT-like responses in both sessions. Responses within the lateral gyrus pretreatment were seen at a lowered statistical threshold. Bottom row: responses in an animal studied 18 mo after treatment.
Figure 3
Figure 3. Cortical Responses in RPE65-Mutant Dogs (Analyzed as a Group) before and after Treatment Compared to Normal Dogs
(A) Areas of cortical activation to visual stimulation are shown in red and yellow on the inflated cortical surface from medial and lateral views (inset shows surface rendering of the initial, folded canine brain). Shades of gray indicate gyral (light) and sulcal (dark) cortex, and the position of three sulci (m, marginal; e, ectomarginal; s, suprasylvian) are marked for reference. In untreated animals (n = 3), a small response within the lateral gyrus is present. After treatment (n = 5), robust responses in both the lateral gyrus (striate and parastriate cortex) as well as in more laterally located extrastriate areas are seen. The position of the lateral gyrus region of interest examined in (B) is outlined in black on the medial surface of the data from the control animals (n = 2). At bottom left the shape of the average canine hemodynamic response (solid white) and its first derivative (dashed white) to 21 s of visual stimulation (yellow bar) are shown. (B) The extent of response within the lateral gyrus region of interest is plotted for treated (unfilled circles), compared to wild-type (squares), and untreated (filled circles) dogs. Vertical dotted lines connect results with pre- and post-treatment evaluations. There is a significant increase in cortical response to light following gene therapy.
Figure 4
Figure 4. Retinal and Subcortical Dysfunction in Human LCA Due to RPE65 Mutations
(A) Shown are visual thresholds to a full-field stimulus (white, 200 ms) in normal participants (±2 SD) and RPE65-LCA patients showing abnormalities of at least 4 log units. (B) Retinal structure by optical coherence tomography is shown. (Left) Cross-sectional retinal images are along the horizontal meridian through the fovea for normal (top) and patient 6 (P6) (bottom). PR, photoreceptor layer; F, fovea; T, temporal; N, nasal. (Right) Polar plot of nerve fiber layer thickness along a circle (diameter 3.4 mm) centered on the optic nerve head is shown. Gray area, normal mean ± 2 SD; S, superior; I, inferior. (C) Retinal electrophysiology by ERG is shown. Left: ERGs to white flashes in the dark- and light-adapted states for patient 2 (P2) and an age-matched normal are shown. Stimulus intensities for dark-adapted responses span 5.2 log units. Patient 2 (P2) shows recordable responses only to the higher stimulus intensities, and amplitudes are severely reduced (note 10-fold change in amplitude scale). Calibration bars are in μV for amplitude and ms for time; stimulus onset is at trace onset. Right: Summary results from patients (circles) show dark-adapted threshold elevations in excess of 3.5 log units from normal (square, mean ± 2 SD). nd, nondetectable. (D) Brainstem responses using TPLR in normal participants and RPE65-LCA patients are shown. Left: Change in horizontal pupil diameter evoked by light stimulus in a normal individual (unfilled squares) compared to patient 3 (P3) (filled symbols) is presented. The smaller and slower pupil response in the patient resembles the normal response to a 5.7 log unit dimmer flash (gray line). Response thresholds were determined at 0.6 s (vertical dashed line). Inset: Images of the pupil before and 0.6 s after a stimulus (2.3 log scot-cd.m2; 100 ms; green). Calibration bar, 6 mm. Right: Summary results from patients (circles) showing threshold elevations in excess of 4 log units from normal (square, mean ± 2 SD).
Figure 5
Figure 5. Visual Brain Anatomy in Human LCA from RPE65 Mutations
(A) Interpial optic nerve diameter for patients and controls is shown. Left: Locations of optic nerve measurements were made for patient 3 (P3) upon high-resolution T2-weighted images. The average of six measurements (three from each nerve) were obtained for each participant. Right: Average optic nerve diameters for RPE65-LCA patients and controls is shown. No population difference was observed. (B) Whole brain morphometric analysis. Left: The T1-weighted anatomical images from RPE65 patients and controls were warped to a representative template (top row). The (log) determinant of the Jacobian matrix calculated during warping for each participant (bottom row) indexes the degree to which cerebral tissue is smaller or larger than the template image. No differences between patients and controls were present in a whole brain analysis of these measures. A focused analysis was conducted within the LGN and occipital lobe white matter, indicated in yellow and red on the registered anatomy. Also shown is the y- or z-position (mm) of each slice relative to the anterior commissure. Right: The average (log) Jacobian measure within the regions of interest for RPE65-LCA patients and controls is shown. Measures were slightly, but significantly, smaller for patients within occipital white matter, indicating relative atrophy.
Figure 6
Figure 6. Mean Cortical Signal Change in Response to Visual Stimulation in Human RPE65-LCA (n = 6) and Control Populations (n = 8)
(A and B) The BOLD fMRI response is shown for each population at two stimulus intensities: (A) −3 log and (B) at/near maximum (between −1.2 log and 0 log). The areas of response are displayed upon a digitally inflated right hemisphere. Sulci are indicated in dark gray and gyri in light gray. (Insets) The general position of several retinotopic and higher-order visual areas, derived from data from control participants, is shown. Visual area nomenclature is as published [37]. (C) Cortical activation as a function of stimulus luminance is presented. The volume of posterior cortical tissue demonstrating a substantial (>2%) response shows a sigmoidal relationship to the strength of visual stimulation in normal controls and in patients. A Hill function (gray smooth lines) is fit by eye to the data points corresponding to each participant.

References

    1. Acland GM, Aguirre GD, Ray J, Zhang Q, Aleman TS, et al. Gene therapy restores vision in a canine model of childhood blindness. Nat Genet. 2001;28:92–95. - PubMed
    1. Acland GM, Aguirre GD, Bennett J, Aleman TS, Cideciyan AV, et al. Long-term restoration of rod and cone vision by single dose rAAV-mediated gene transfer to the retina in a canine model of childhood blindness. Mol Ther. 2005;12:1072–1082. - PMC - PubMed
    1. Batten ML, Imanishi Y, Tu DC, Doan T, Zhu L, et al. Pharmacological and rAAV gene therapy rescue of visual functions in a blind mouse model of Leber congenital amaurosis. PLoS Med. 2005;2:e333. doi: 10.1371/journal.pmed.0020333. - DOI - PMC - PubMed
    1. Pawlyk BS, Smith AJ, Buch PK, Adamian M, Hong DH, et al. Gene replacement therapy rescues photoreceptor degeneration in a murine model of Leber congenital amaurosis lacking RPGRIP. Invest Ophthalmol Vis Sci. 2005;46:3039–3045. - PubMed
    1. Williams ML, Coleman JE, Haire SE, Aleman TS, Cideciyan AV, et al. Lentiviral expression of retinal guanylate cyclase-1 (RetGC1) restores vision in an avian model of childhood blindness. PLoS Med. 2006;3:e201. doi: 10.1371/journal.pmed.0030201. - DOI - PMC - PubMed

Publication types

MeSH terms