. 2007 Aug;10(8):663-72.
doi: 10.1111/j.1461-0248.2007.01063.x.

Towards a collaborative, global infrastructure for biodiversity assessment

Affiliations

Towards a collaborative, global infrastructure for biodiversity assessment

Robert P Guralnick et al. Ecol Lett. 2007 Aug.

Abstract

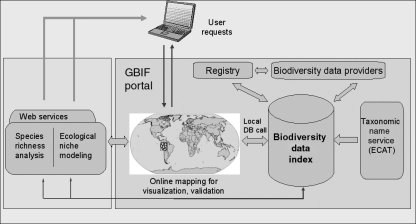
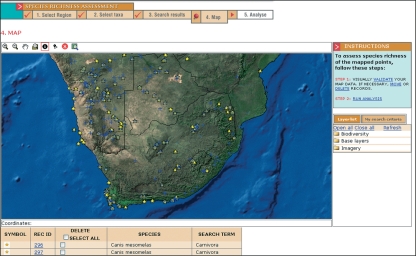
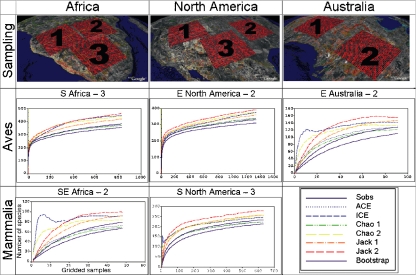
Biodiversity data are rapidly becoming available over the Internet in common formats that promote sharing and exchange. Currently, these data are somewhat problematic, primarily with regard to geographic and taxonomic accuracy, for use in ecological research, natural resources management and conservation decision-making. However, web-based georeferencing tools that utilize best practices and gazetteer databases can be employed to improve geographic data. Taxonomic data quality can be improved through web-enabled valid taxon names databases and services, as well as more efficient mechanisms to return systematic research results and taxonomic misidentification rates back to the biodiversity community. Both of these are under construction. A separate but related challenge will be developing web-based visualization and analysis tools for tracking biodiversity change. Our aim was to discuss how such tools, combined with data of enhanced quality, will help transform today's portals to raw biodiversity data into nexuses of collaborative creation and sharing of biodiversity knowledge.


Figures

Figure 1
Figure 1
A screenshot from the Keyhole Markup Language of Species-Occurrence Record Density (KSORD) tool. In the foreground are individual record distributions of Thomomys bottae (Botta's Pocket Gopher) in western North America; at further distances from the point-of-view are progressively larger boxes that summarize record density in the given area. Darker tones represent greater density of records. Inset: The same region of western North America as viewed from altitude.
Figure 2
Figure 2
Diagram presenting an integrated workflow for biodiversity assessment. The Global Biodiversity Information Facility (GBIF) portal includes a biodiversity data index which caches a subset of the total incoming data from multiple providers. Two other GBIF portal services that are linked to this index are the taxonomic name service and an online GIS. The latter provides a means for users to view biodiversity in regions of interest and potentially modify and validate those data sets from which the viewed data are derived. Biodiversity analysis web services located anywhere on the Internet can ‘deep link’ to the GBIF portal such that data from the GBIF portal can be sent to these analytical services to perform for example, ecological niche modelling or species richness assessment. Results of the analyses that have employed GBIF-mediated data are returned to the user, with metadata that identify the source data provider(s), so that the analysis can be repeated and verified, and so the data provider(s) can be given attribution in any publication(s) resulting from the analysis(es).
Figure 3
Figure 3
Screenshot of Global Biodiversity Information Facility (GBIF) Mapping and Analysis Portal Application at the map and validation step of performing a species richness analysis. In the previous step, a region of southern Africa was selected and searched for two mammal groups. The GBIF data cache returned 935 Carnivora records (yellow stars) and 5411 Rodentia records (blue stars), respectively. Using online GIS tools, users at this step can select occurrence data points, either on the map or in the table at the bottom of the web page, and move or delete records. Having performed this validation step, the user can then perform a set of analyses based on this occurrence data set.
Figure 4
Figure 4
A Google Earth view of the sampling grids and resultant species richness estimates of birds and mammals for some of the nine equal area regions selected for comparison. The numbered grids for different areas are shown in the top row of panels. The middle and bottom rows show species richness estimate curves for birds and mammals, respectively. The numbering in each graph title refers to the numbered grid in the top panels. The graphs show that in some regions, estimators tend to give relatively similar estimates close to observed richness and nearly plateau (e.g. North America) while in other regions, data sets are not close to the maximum number of observable species given sampling methodologies (e.g. regions of Africa and Australia).
Figure 5
Figure 5
A screenshot from Google Earth showing the spread of H5N1 avian influenza lineages across the Eurasian continent. Here, Janies et al. (2007) illustrate the mutation of a key amino acid thought to regulate host switching events in mammals – the lineages coloured red have that mutation while lineages in white do not. Note that the lineages bearing this key mutation arose around the same time that the H5N1 virus spread westward out of eastern Asia.

References

    1. Beaman R, Conn B. Automated geoparsing and georeferencing of Malesian collection locality data. Telopea. 2003;10:43–52.
    1. Bisby FA, Ruggiero MA, Wilson KL, Cachuela-Palacio M, Kimani SW, Roskov YR, et al. Species 2000 & ITIS Catalogue of Life: 2005 Annual Checklist. (CD-ROM; Species 2000): Reading, UK; 2005.
    1. Butler D. Mashups mix data into global service. Nature. 2006;439:6–7. - PubMed
    1. Ceballos G, Ehrlich PR. Global mammal distributions, biodiversity hotspots, and conservation. Proc. Natl Acad. Sci. USA. 2006;103:19374–19379. - PMC - PubMed
    1. Chapman AD. Principles of Data Quality, version 1.0. Report for the Global Biodiversity Information Facility. Denmark: Copenhagen; 2005a. pp. 1–58.

Publication types

LinkOut - more resources