Comparative Study
. 2007 Jun 26:6:23.
doi: 10.1186/1475-925X-6-23.

Exploiting nonlinear recurrence and fractal scaling properties for voice disorder detection

Affiliations
Comparative Study

Exploiting nonlinear recurrence and fractal scaling properties for voice disorder detection

Max A Little et al. Biomed Eng Online. .

Abstract

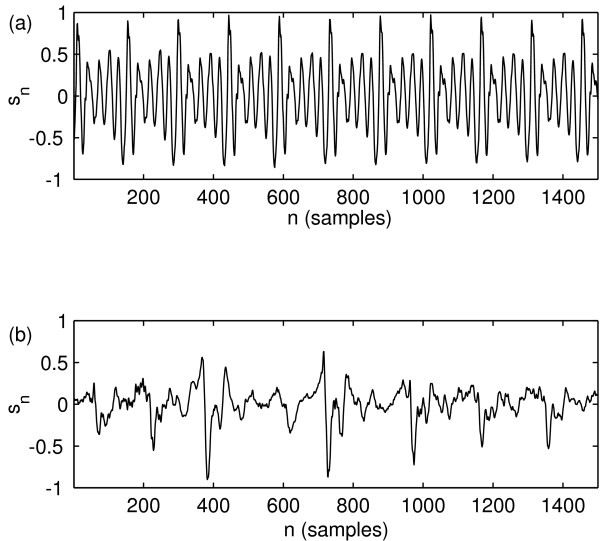
Background: Voice disorders affect patients profoundly, and acoustic tools can potentially measure voice function objectively. Disordered sustained vowels exhibit wide-ranging phenomena, from nearly periodic to highly complex, aperiodic vibrations, and increased "breathiness". Modelling and surrogate data studies have shown significant nonlinear and non-Gaussian random properties in these sounds. Nonetheless, existing tools are limited to analysing voices displaying near periodicity, and do not account for this inherent biophysical nonlinearity and non-Gaussian randomness, often using linear signal processing methods insensitive to these properties. They do not directly measure the two main biophysical symptoms of disorder: complex nonlinear aperiodicity, and turbulent, aeroacoustic, non-Gaussian randomness. Often these tools cannot be applied to more severe disordered voices, limiting their clinical usefulness.

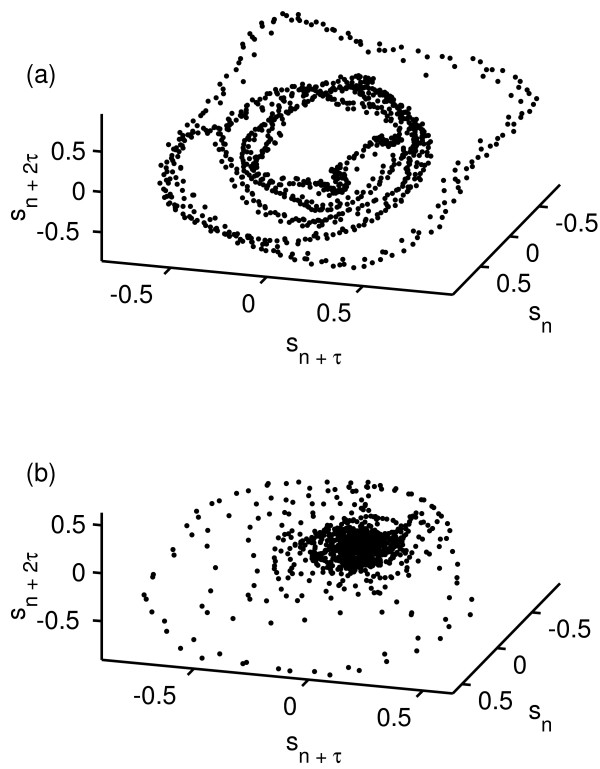
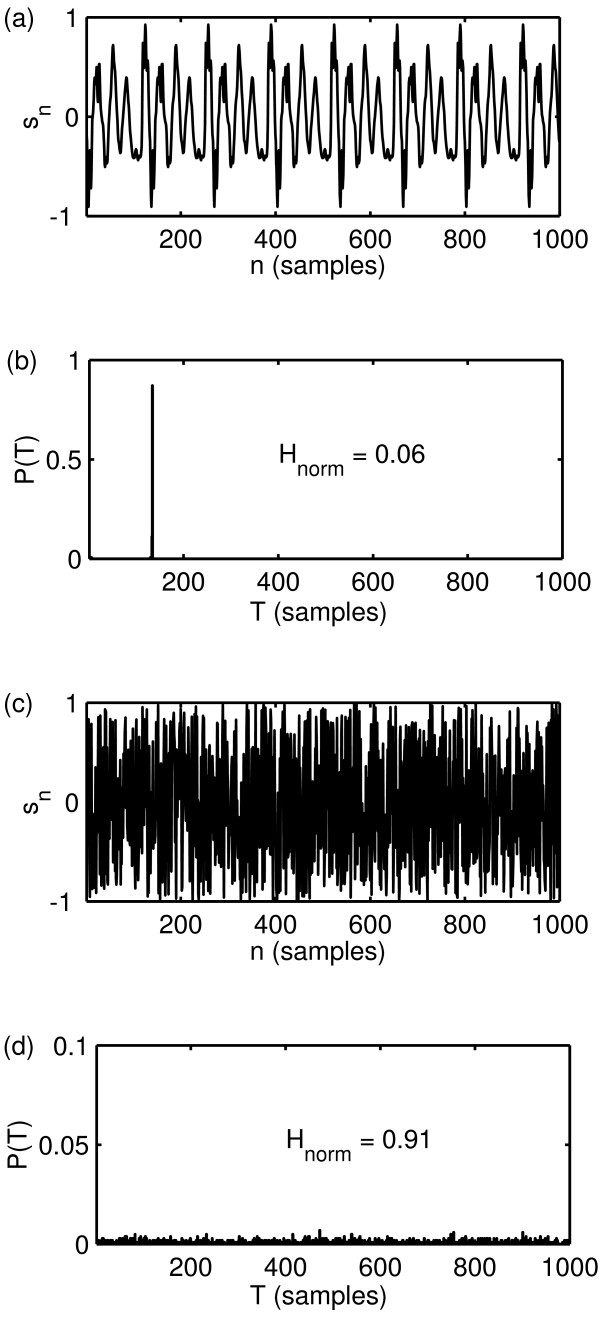
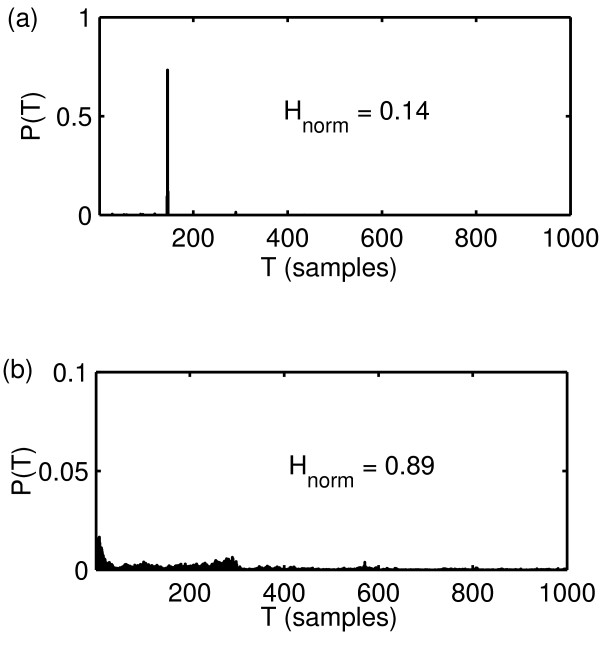
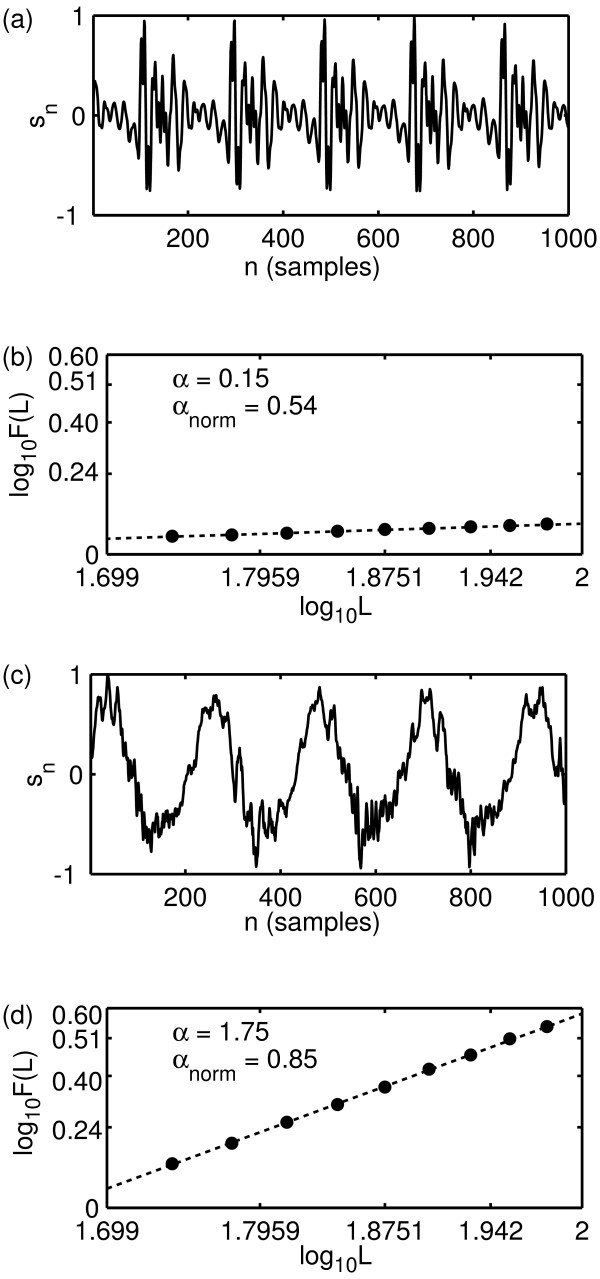
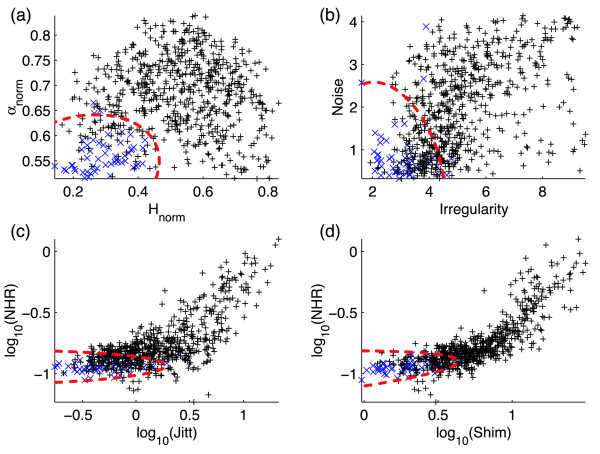
Methods: This paper introduces two new tools to speech analysis: recurrence and fractal scaling, which overcome the range limitations of existing tools by addressing directly these two symptoms of disorder, together reproducing a "hoarseness" diagram. A simple bootstrapped classifier then uses these two features to distinguish normal from disordered voices.

Results: On a large database of subjects with a wide variety of voice disorders, these new techniques can distinguish normal from disordered cases, using quadratic discriminant analysis, to overall correct classification performance of 91.8 +/- 2.0%. The true positive classification performance is 95.4 +/- 3.2%, and the true negative performance is 91.5 +/- 2.3% (95% confidence). This is shown to outperform all combinations of the most popular classical tools.

Conclusion: Given the very large number of arbitrary parameters and computational complexity of existing techniques, these new techniques are far simpler and yet achieve clinically useful classification performance using only a basic classification technique. They do so by exploiting the inherent nonlinearity and turbulent randomness in disordered voice signals. They are widely applicable to the whole range of disordered voice phenomena by design. These new measures could therefore be used for a variety of practical clinical purposes.


Figures

Figure 1
Figure 1
Selected normal and disordered speech signal examples. Discrete-time signals from (a) one normal (JMC1NAL) and (b) one disordered (JXS01AN) speech signal from the Kay Elernetrics database. For clarity only a small section is shown (1500 samples).
Figure 2
Figure 2
Selected time-delay embedded speech signals. Time-delay embedded discrete-time signals from (a) one normal (JMC1NAL) and (b) one disordered (JXS01AN) speech signal from the Kay Elernetrics database. For clarity only a small section is shown (1500 samples). The embedding dimension is m = 3 and the time delay is τ = 7 samples.
Figure 3
Figure 3
State-space recurrence analysis for a periodic signal. Demonstration of results of time-delayed state-space recurrence analysis applied to a perfectly periodic signal (a) created by taking a single cycle (period k = 134 samples) from a speech signal and repeating it end-to-end many times. The signal was normalised to the range [-1, 1]. (b) All values of P(T) are zero except for P(133) = 0.1354 and P(134) = 0.8646 so that P(T) is properly normalised. This analysis is also applied to (c) a synthesised, uniform i.i.d. random signal on the range [-1, 1], for which (d) the density P(T) is fairly uniform. For clarity only a small section of the time series (1000 samples) and the recurrence time (1000 samples) is shown. Here, Tmax = 1000. The length of both signals was 18088 samples. The optimal values of the recurrence analysis parameters were found at r = 0.12, m = 4 and τ = 35.
Figure 4
Figure 4
RPDE analysis results. Results of RPDE analysis carried out on the two example speech signals from the Kay database as shown in figure 1. (a) Normal voice (JMC1NAL), (b) disordered voice (JXS01AN). The values of the recurrence analysis parameters were the same as those in the analysis of figure 3. The normalised RPDE value Hnormis larger for the disordered voice.
Figure 5
Figure 5
DFA analysis results. Results of scaling analysis carried out on two more example speech signals from the Kay database. (a) Normal voice (GPG1NAL) signal, (c) disordered voice (RWR14AN). Discrete-time signals sn shown over a limited range of n for clarity. (b) Logarithm of scaling window sizes L against the logarithm of fluctuation size F(L) for normal voice in (a). (d) Logarithm of scaling window sizes L against the logarithm of fluctuation size F(L) for disordered voice in (b). The values of L ranged from L = 50 to L = 100 in steps of five. In (b) and (d), the dotted line is the straight-line fit to the logarithms of the values of L and F(L) (black dots). The values of α and the normalised version αnorm show an increase for the disordered voice.
Figure 6
Figure 6
"Hoarseness" diagrams. "Hoarseness" diagrams illustrating graphically the distinction between normal (blue '+' symbols) and disordered (black '+' symbols) on all speech examples from the Kay Elemetrics dataset, for (a) the new measures return period density entropy (RPDE) (horizontal axis) and detrended fluctuation analysis (DFA) (vertical axis), (b) for the irregularity (horizontal) and noise (vertical) components of Michaelis [4], (c) for classical perturbation measures jitter (horizontal) and noise-to-harmonics ratio (NHR) (vertical) and (d) shimmer (horizontal) against NHR (vertical). The red dotted line shows the best normal/disordered classification task boundary over 1000 bootstrap trials using quadratic discriminant analysis (QDA). The values of the RPDE and DFA analysis parameters were the same those in the analysis of figures 3 and 5 respectively. The logarithm of the classical perturbation measures was used to improve the classification performance with QDA.

References

    1. Baken RJ, Orlikoff RF. Clinical Measurement of Speech and Voice. 2. San Diego: Singular Thomson Learning; 2000.
    1. Carding PN, Stecn IN, Webb A, Mackenzie K, Deary IJ, Wilson JA. The reliability and sensitivity to change of acoustic measures of voice quality. Clinical Otolaryngology. 2004;29:538–544. doi: 10.1111/j.1365-2273.2004.00846.x. - DOI - PubMed
    1. Dejonckere PH, Bradley P, Clemente P, Cornut G, Crevier-Buchman L, Friedrich G, Van De Heyning P, Remacle M, Woisard V. A basic protocol for functional assessment of voice pathology, especially for investigating the efficacy of (phonosurgical) treatments and evaluating new assessment techniques. Guideline elaborated by the Committee on Phoniatrics of the European Laryngological Society (ELS) Eur Arch Otorhinolaryngol. 2001;258:77–82. doi: 10.1007/s004050000299. - DOI - PubMed
    1. Michaelis D, Frohlich M, Strube HW. Selection and combination of acoustic features for the description of pathologic voices. Journal of the Acoustical Society of America. 1998;103:1628–1639. doi: 10.1121/1.421305. - DOI - PubMed
    1. Boyanov B, Hadjitodorov S. Acoustic analysis of pathological voices. IEEE Eng Med Biol Mag. 1997;16:74–82. doi: 10.1109/51.603651. - DOI - PubMed

Publication types