

doi: 10.1186/gb-2007-8-6-r124.
Measuring the accuracy of genome-size multiple alignments
Affiliations
- PMID: 17594489
- PMCID: PMC2394773
- DOI: 10.1186/gb-2007-8-6-r124
Item in Clipboard
Measuring the accuracy of genome-size multiple alignments
Genome Biol.
2007.
Abstract
Whole-genome alignments are invaluable for comparative genomics. Before doing any comparative analysis on a region of interest, one must have confidence in that region's alignment. We provide a methodology to measure the accuracy of arbitrary regions of these alignments, and apply it to the UCSC Genome Browser's 17-vertebrate alignment. We identify 9.7% (21 Mbp) of the human chromosome 1 alignment as suspiciously aligned. We present independent evidence that many of these suspicious regions represent misalignments.
Figures

Distribution of alignment segment p-values. Fraction of residues in segments of length at least 50 bp plotted against the p-value of that segment's score, for the branches of the phylogeny incident on zebrafish, chicken, mouse, and chimp. The zebrafish and chicken graphs are so close as to be nearly indistinguishable.

Sample suspicious zebrafish alignment. The MULTIZ alignment block at human coordinates chr1: 87,801,892-87,801,950, covering 59 bp of human sequence. Lower case letters indicate disagreement with the human sequence.

Pie charts showing the genomic distribution of suspicious regions for zebrafish and mouse. UTR, untranslated region.
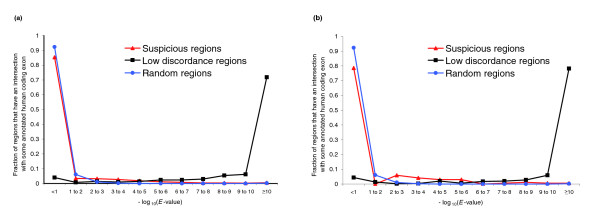
Distribution of BLASTX E-values in coding regions. (a) Distribution of BLASTX E-values for ℜzebrafish and low discordance (≤10-10) zebrafish alignment regions intersecting human coding exons. The distribution is also plotted for random zebrafish nucleotide sequences. (b) The analogous distributions for mouse.

Percentage of frameshifted codons. Distribution of ℜzebrafish and low discordance (≤10-10) zebrafish alignment regions intersecting some annotated human coding exons, plotted against the percentage of frameshifted zebrafish codons (in the region aligned to the human exon).
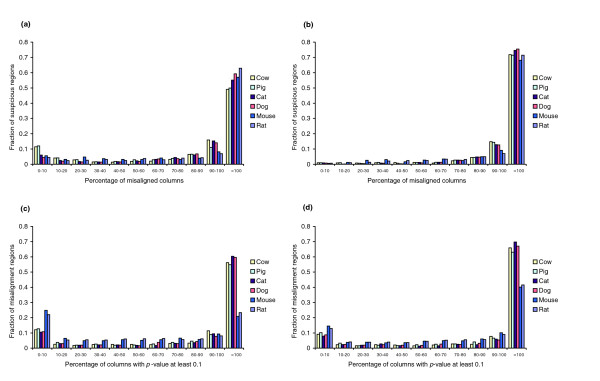
Specificity and sensitivity for simulated data. Results averaged over 25 simulated data sets, each of size approximately 100 Kb, that are aligned by TBA. (a) Specificity with respect to the same species: for each suspicious region reported by StatSigMA-w, the histogram shows the percentage of its columns for which the species reported as suspicious is actually misaligned by TBA. (b) Specificity with respect to any species: for each suspicious region reported by StatSigMA-w, the histogram shows the percentage of its columns for which any species is actually misaligned by TBA. (c) Sensitivity with respect to the same species: for each misalignment region, the histogram shows the percentage of its columns for which StatSigMA-w reports a p-value at least 0.1 for a branch attributable to the misaligned species. (d) Sensitivity with respect to any species: for each misalignment region, the histogram shows the percentage of its columns for which StatSigMA-w reports a p-value at least 0.1 for any branch.
References
Publication types
MeSH terms
Grants and funding
LinkOut - more resources
Full Text Sources
Miscellaneous
