

doi: 10.1098/rsif.2007.1079.
Information-theoretic sensitivity analysis: a general method for credit assignment in complex networks
Affiliations
- PMID: 17594961
- PMCID: PMC2386561
- DOI: 10.1098/rsif.2007.1079
Item in Clipboard
Information-theoretic sensitivity analysis: a general method for credit assignment in complex networks
J R Soc Interface.
.
Abstract
Most systems can be represented as networks that couple a series of nodes to each other via one or more edges, with typically unknown equations governing their quantitative behaviour. A major question then pertains to the importance of each of the elements that act as system inputs in determining the output(s). We show that any such system can be treated as a 'communication channel' for which the associations between inputs and outputs can be quantified via a decomposition of their mutual information into different components characterizing the main effect of individual inputs and their interactions. Unlike variance-based approaches, our novel methodology can easily accommodate correlated inputs.
Figures
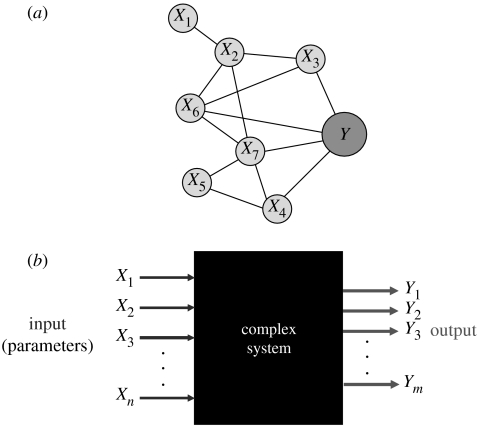
Complex systems with multiple inputs and outputs. This is a typical situation in systems biology. For instance, pathway models (a) are described by sets of coupled nonlinear ODEs (deterministic or stochastic). Input–output relations can only be elucidated by numerical evaluation of the system output, e.g. a flux, for various configurations of the input parameters. Global sensitivity analysis aims to determine the degree to which these inputs control the output, and how they interact. In most applications, the input–output mapping is nonlinear and not given in closed form; hence, the system is a ‘black box’ (b).

Schematic of the NFκB signalling pathway (isoforms of IκBα not shown). Solid arrows denote reactions and dashed arrows indicate translocation. In the model, an external stimulation suddenly raises the concentration of IKK, which catalyses the degradation of IκBα, leading to the release of NFκB that can then translocate to the nucleus. In the nucleus, NFκB regulates the expression of genes leading to a resynthesis of the IκBα inhibitor proteins. The newly synthesized IκBα binds to the nuclear NFκB forming an IκBα–NFκB complex, whereby NFκB is shuttled back to the cytoplasm thus initiating a negative feedback loop.

Example time course of the concentration of nuclear NFκB as determined by solving an ODE model. Characteristic output features include, among others, the timing T and amplitudes A of the peaks or functions thereof, such as P1=T2−T1. These features are considered to encode a signal that triggers subsequent cell fate via apoptosis or proliferation, for instance.

First-order sensitivity indices with respect to feature P1 (time difference between the first two maxima in the time course of nuclear NFκB concentration). Out of a total of n=64 parameters only a few exert significant influence on the feature.
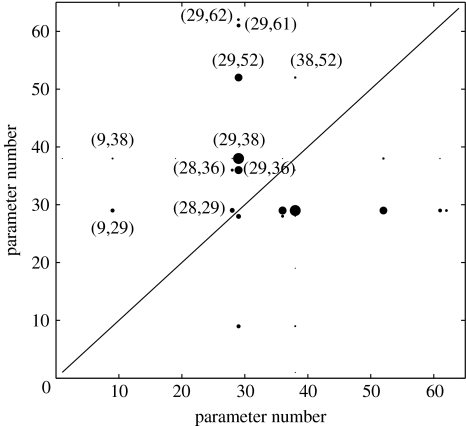
Second-order sensitivity indices in the form of an interaction matrix. The radius of the filled circles indicates the magnitude of sensitivity indices. The dependence structure is quite sparse. Only pairs with at least one individually relevant partner have significant interactions. The predominant contributions are by pairs where both partners have significant individual impact.

Third-order sensitivity indices. A sparse dependence structure is also found at the level of tripletwise interactions. The horizontal line marks the significance threshold (bootstrap mean plus 3 standard deviations, cf. §3.2).

Example of a Monte Carlo estimate of the discretization entropy as a function of the number of bin configurations, computed for the feature P1 of the nuclear NFκB concentration. The graph shows a rapid convergence of the cumulative average over the regional output entropies computed from randomly selected input bin configurations, even though the total number of possible bin configurations (1564) vastly exceeds the number of actually sampled bins (up to 800). For each bin configuration, the input–output map was evaluated 100 times, which resulted in an accurate calculation of the corresponding conditional entropy.

Block diagram of the information balance for a particular feature (P1) in the NFκB oscillation (cf. figure 3). The height of the entire block equals the output uncertainty (entropy). All contributions are normalized with respect to the total information, the amount of output uncertainty the inputs account for. The remainder HΔ is the uncertainty due to the discretization of input values (c.f. §2.4). Obviously in this case, fourth- and higher order terms contribute a significant portion of the output entropy, indicating a high degree of parameter interaction. This result is supported by the high total sensitivity indices observed in the eight most significant parameters (cf. figure 9).

Comparison of first-order and total sensitivity indices for the most significant parameters with respect to feature P1 (cf. figure 3). The difference between the two measures indicates the parameter's degree of interaction. A total sensitivity value close to unity, as in parameter 29, indicates that the parameter and its interaction partners almost fully describe the system. Note, the total sensitivity indices do not sum to unity, unless there are no interactions, in which case first-order and total sensitivity indices are equal (additive system). In the example studied here, the interactions clearly dominate.

Graphs of the sigmoid pulse functions gλ and hλ.
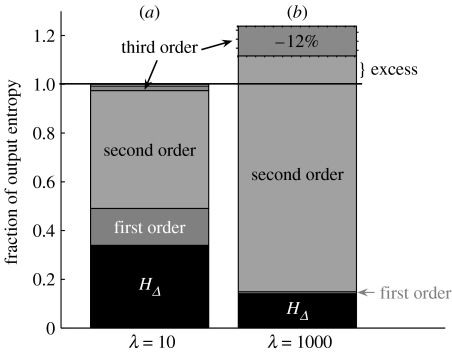
Schematic visualization of information-theoretic sensitivity indices by a block diagram. (a) Block diagram of an information balance with positive conditional interaction information (CII). Its components are the discretization entropy HΔ, the first-order sensitivity indices, the second-order indices and the third-order index given by the conditional interaction information. In this example, the CII is positive and hence an integral component of the output entropy, i.e. the sum of sensitivity indices is less or equal to the output entropy, with equality being reached once all relevant terms have been added. (b) Block diagram with negative CII. Here, the sum of discretization entropy plus first- and second-order terms exceeds the output entropy. The magnitude of the negative CII equals the information excess. The sum of all indices does equal the output entropy, but the sensitivity indices have different signs. In this case, an interpretation of the CII as a third-order sensitivity index is not meaningful, since the input pairs do not contribute independent pieces of information, yielding non-orthogonal information decomposition.
References
-
- Alon U. Chapman and Hall/CRC; London, UK: 2006. An introduction to systems biology: design principles of biological circuits.
-
- Amari S. Information geometry on hierarchy of probability distributions. IEEE Trans. Inf. Theory. 2001;47:1701–1711. doi: 10.1109/18.930911. - DOI
-
- Box G.E.P, Hunter W.G, Hunter J.S. Wiley; New York, NY: 1978. Statistics for experimenters.
Publication types
MeSH terms
Substances
Grants and funding
LinkOut - more resources
Full Text Sources
Other Literature Sources
