. 2007 Jul;102(2):539-49.
doi: 10.1111/j.1471-4159.2007.04594.x.

Glutamate production by HIV-1 infected human macrophage is blocked by the inhibition of glutaminase

Affiliations

Glutamate production by HIV-1 infected human macrophage is blocked by the inhibition of glutaminase

Nathan Erdmann et al. J Neurochem. 2007 Jul.

Abstract

Mononuclear phagocyte (macrophages and microglia) dysfunction plays a significant role in the pathogenesis of human immunodeficiency virus (HIV) associated dementia (HAD) through the production and release of soluble neurotoxic factors including glutamate. The mechanism of glutamate regulation by HIV-1 infection remains unclear. In this report, we investigated whether the enzyme glutaminase is responsible for glutamate generation by HIV-1 infected monocyte-derived macrophages. We tested the functionality of novel small molecule inhibitors designed to specifically block the activity of glutaminase. Glutaminase inhibitors were first characterized in a kinetic assay with crude glutaminase from rat brain revealing an uncompetitive mechanism of inhibition. The inhibitors were then tested in vitro for their ability to prevent glutamate generation by HIV-infected macrophages, their effect upon macrophage viability, and HIV infection. To validate these findings, glutaminase specific siRNA was tested for its ability to prevent glutamate increase during infection. Our results show that both glutaminase specific small molecule inhibitors and glutaminase specific siRNA were effective at preventing increases in glutamate by HIV-1 infected macrophage. These findings support glutaminase as a potential component of the HAD pathogenic process and identify a possible therapeutic avenue for the treatment of neuroinflammatory states such as HAD.


Figures

Fig. 1
Fig. 1
HIV-1-mediated glutamate production is dependent on the presence of glutamine. Human monocyte-derived macrophages were infected with HIV-1ADA for 7 days and then incubated in serum-free neurobasal media with or without 5 mmol/L glutamine. The concentration of glutamate in cell-free supernatants was determined by RP-HPLC. All data are expressed as absolute concentration of glutamate (μmol/L). Results are expressed as average ± SD of triplicate samples and are representative of three different donors. *Denotes p < 0.01 in comparison with control.
Fig. 2
Fig. 2
Profile of glutaminase inhibitors in enzyme activity assay with rat brain glutaminase. The glutaminase inhibitors are designated as 14256, 19560, 20767, and negative controls 20638 and 5000. Inhibitors applied at concentrations of 0, 1, 3, 10, 25, 30, 50, 75, 100, 200, 300 μmol/L to reaction mix containing 10 mmol/L glutamine, 50 μg rat brain glutaminase and 150 mmol/L phosphate. Results are expressed as average ± SD of triplicate samples (% of inhibition as compared with control) and are representative of three independent experiments.
Fig. 3
Fig. 3
Glutamine saturation profile of inhibitor 14256. Glutaminase added to assay containing various concentrations of substrate glutamine (0-40 mmol/L) in the presence of 0, 30 and 100 μmol/L inhibitor 14256 with reaction mix containing 50 μg rat brain glutaminase and 150 mmol/L phosphate. In panel (a), enzyme activity is plotted as glutamate versus glutamine concentration. The VMAX as determined by GraphPad (GraphPad Software) was 15.0 ± 0.47, 5.0 ± 0.25, and 0.75 ± 0.05 and the KM values were determined to be 12.3 ± 0.99, 7.7 ± 1.27, 2.5 ± 1.03 for 14256 treatments of 0, 30, and 100 μmol/L. In panel (b), a Lineweaver-Burk plot of the substrate-velocity curve is shown. Values measured in triplicate, error bars represent SD for each glutamine concentration and are representative of three independent experiments.
Fig. 4
Fig. 4
Glutamine saturation profile of inhibitor 19560. Glutaminase added to assay containing various concentrations of substrate glutamine (0-40 mmol/L) in the presence of 0, 30, and 100 μmol/L inhibitor 14256 with reaction mix containing 50 μg rat brain glutaminase and 150 mmol/L phosphate. In panel (a), enzyme activity is plotted as glutamate versus glutamine concentration. The VMAX as determined by GraphPad was 14.8 ± 0.62, 5.4 ± 0.20, and 0.60 ± 0.04 and the KM values were determined to be 13.0 ± 1.3, 8.8 ± 0.97, 3.0 ± 0.89 for 19560 treatments of 0, 30, and 100 μmol/L. In panel (b), a Lineweaver-Burk plot of the substrate-velocity curve is shown. Values measured in triplicate, error bars represent SD for each glutamine concentration and are representative of three independent experiments.
Fig. 5
Fig. 5
Glutaminase inhibitor treatment at 3, 5, and 7 days post-infection of human macrophage. Human monocyte-derived macrophages were infected with HIV-1ADA for either 3, 5, or 7 days and incubated in serum-free neurobasal media with or without glutaminase inhibitors. The glutaminase inhibitors were applied at a final concentration of 10 μmol/L. The concentration of glutamate in cell-free supernatants was determined by RP-HPLC. All data are expressed as absolute concentration of glutamate (μmol/L). Results are expressed as average ± SD of triplicate samples and are representative of three different donors. *Denotes p < 0.01 in comparison with control, #denotes p < 0.01 in comparison with HIV-1ADA.
Fig. 6
Fig. 6
Inhibitors reduced glutamate levels in infected macrophage cultures. Human monocyte-derived macrophages were infected with HIV-1ADA for 7 days. Cells were washed and incubated in serum-free neurobasal media or in media containing glutaminase inhibitors at concentrations of 0, 0.1, 1, or 10 μmol/L. The concentration of glutamate in cell-free supernatants was determined by RP-HPLC. All data are expressed as absolute concentration of glutamate (μmol/L). Results are expressed as average ± SEM of data obtained from three different donors (triplicate from each donor). *Denotes p < 0.01 in comparison with control, #denotes p < 0.05 in comparison with HIV-1ADA.
Fig. 7
Fig. 7
The blocking of glutamate production induced by different viral strains by glutaminase inhibitors. Human monocyte-derived macrophages were infected with HIV-1ADA, HIV-1JRFL, HIV-1BAL and HIV-189.6 for 8 days. Cells were incubated overnight in serum-free neurobasal media with or without glutaminase inhibitor. The concentration of glutamate in cell-free supernatants was determined by RP-HPLC. Data are expressed as absolute concentration of glutamate (μmol/L). Results are expressed as average ± SEM of data obtained from three different donors (triplicate from each donor). *Denotes p < 0.01 in comparison with control, #denotes p < 0.05 in comparison with HIV.
Fig. 8
Fig. 8
The effect of glutaminase inhibitor treatment on cell viability. Human monocyte-derived macrophages were infected with HIV-1ADA for 7 days. Cells were washed and incubated in serum-free neurobasal media or in media containing glutaminase inhibitors at concentrations of 0, 0.10, 1.0, or 10 μmol/L. Cell viability was assessed by 3-(4,5-dimethylthiazol-2-yl)-2,5-diphenyl tetrazolium bromide (MTT) assay. Cells were incubated with 200 μL of 10% MTT solution after macrophage conditioned media collection. Cell culture plates were incubated for 20-30 min at 37°C. After incubation, MTT solution was removed and 200 μL dimethylsulfoxide was added to each well. Cell viability was determined by measuring optical density at 490 nm in a microplate reader. Results are expressed as average ± SD (n = 3) and are representative of three different donors.
Fig. 9
Fig. 9
The effect of glutaminase inhibitor treatment on HIV infection. Human monocyte-derived macrophages were infected with HIV-1ADA (a), HIV-1BAL (b), HIV-1JRFL (c), and HIV-189.6 (d) for 8 days. Cells were then incubated with glutaminase inhibitors 14256, 19560, 20767, 20638, and 5000 at concentrations of 0 and 10 μmol/L. Quantitation was verified through measurement of reverse-transcriptase (RT) activity in cell-free supernatants from monocyte-derived macrophages infected by different HIV strains. Results are expressed as average ± SD of three samples and are representative of three different donors.
Fig. 10
Fig. 10
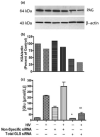
siRNA treatment targeting glutaminase in infected human macrophage. Human monocyte-derived macrophages were grown in culture and then infected with HIV-1ADA. Infected monocyte-derived macrophages were then transfected with siRNA targeting glutaminase or non-specific control. (a) Whole cell lysates were collected and analyzed by western blot for phosphate activated glutaminase. (b) Bands were quantitated and values expressed are as compared with β-actin. (c) Supernatants were analyzed for glutamate concentration. Results are expressed as average ± SD of three samples and are representative of three different donors.

References

    1. Anderson ER, Gendelman HE, Xiong H. Memantine protects hippocampal neuronal function in murine human immunodeficiency virus type 1 encephalitis. J. Neurosci. 2004;24:7194–7198. - PMC - PubMed
    1. Belmadani A, Zou J, Schipma MJ, Neafsey EJ, Collins MA. Ethanol pre-exposure suppresses HIV-1 glycoprotein 120-induced neuronal degeneration by abrogating endogenous glutamate/Ca2+-mediated neurotoxicity. Neuroscience. 2001;104:769–781. - PubMed
    1. Chen HS, Lipton SA. The chemical biology of clinically tolerated NMDA receptor antagonists. J. Neurochem. 2006;97:1611–1626. - PubMed
    1. Choi DW. Glutamate neurotoxicity and diseases of the nervous system. Neuron. 1988;1:623–634. - PubMed
    1. Curthoys NP, Watford M. Regulation of glutaminase activity and glutamine metabolism. Annu. Rev. Nutr. 1995;15:133–159. - PubMed

Publication types

MeSH terms