Comparative Study
. 2007;9(3):R60.
doi: 10.1186/ar2218.

Comparison of marker gene expression in chondrocytes from patients receiving autologous chondrocyte transplantation versus osteoarthritis patients

Affiliations
Comparative Study

Comparison of marker gene expression in chondrocytes from patients receiving autologous chondrocyte transplantation versus osteoarthritis patients

Reinout Stoop et al. Arthritis Res Ther. 2007.

Abstract

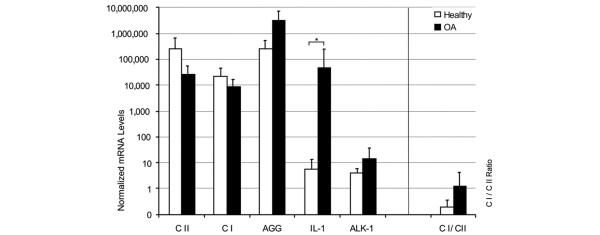
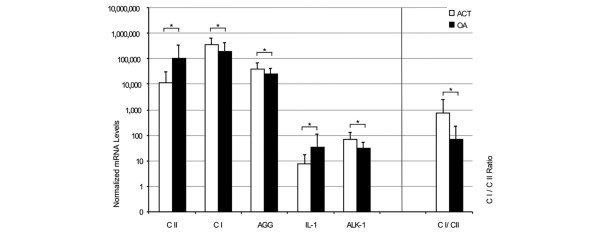
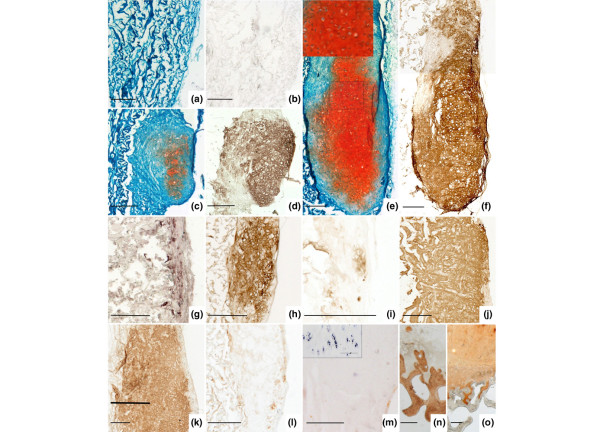
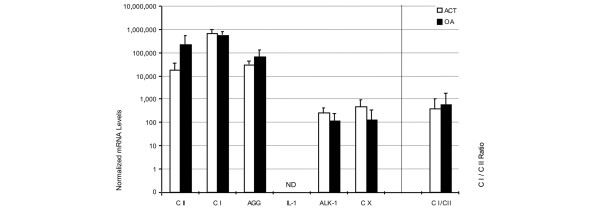
Currently, autologous chondrocyte transplantation (ACT) is used to treat traumatic cartilage damage or osteochondrosis dissecans, but not degenerative arthritis. Since substantial refinements in the isolation, expansion and transplantation of chondrocytes have been made in recent years, the treatment of early stage osteoarthritic lesions using ACT might now be feasible. In this study, we determined the gene expression patterns of osteoarthritic (OA) chondrocytes ex vivo after primary culture and subculture and compared these with healthy chondrocytes ex vivo and with articular chondrocytes expanded for treatment of patients by ACT. Gene expression profiles were determined using quantitative RT-PCR for type I, II and X collagen, aggrecan, IL-1beta and activin-like kinase-1. Furthermore, we tested the capability of osteoarthritic chondrocytes to generate hyaline-like cartilage by implanting chondrocyte-seeded collagen scaffolds into immunodeficient (SCID) mice. OA chondrocytes ex vivo showed highly elevated levels of IL-1beta mRNA, but type I and II collagen levels were comparable to those of healthy chondrocytes. After primary culture, IL-1beta levels decreased to baseline levels, while the type II and type I collagen mRNA levels matched those found in chondrocytes used for ACT. OA chondrocytes generated type II collagen and proteoglycan-rich cartilage transplants in SCID mice. We conclude that after expansion under suitable conditions, the cartilage of OA patients contains cells that are not significantly different from those from healthy donors prepared for ACT. OA chondrocytes are also capable of producing a cartilage-like tissue in the in vivo SCID mouse model. Thus, such chondrocytes seem to fulfil the prerequisites for use in ACT treatment.


Figures

Figure 1
Figure 1
Gene expression patterns of chondrocytes ex vivo. Chondrocytes were isolated from cartilage of healthy individuals (n = 6, white bars) or osteoarthritis (OA) patients (n = 20, black bars). The ex vivo gene expression of type I and II collagen (CI and CII, respectively), aggrecan (AGG), IL-1β and activin-like kinase (ALK)-1 was determined using qRT-PCR. The mRNA levels were normalized to GAPDH and amplified by a factor of 106. The collagen type I to collagen type II mRNA ratio was calculated as a measure for the differentiation status of the chondrocytes. Statistically significant differences (p < 0.05) are marked by asterisks (*).
Figure 2
Figure 2
Gene expression pattern of chondrocytes after primary culture (P0). Chondrocytes isolated from cartilage of patients undergoing autologous chondrocyte transplantation (ACT; n = 40, white bars) or osteoarthritis (OA) patients (n = 26; black bars) were expanded in primary culture for 10 to 12 days and the gene expression of type I and II collagen (CI and CII, respectively), aggrecan (AGG), IL-1β and activin-like kinase (ALK)-1 was determined using qRT-PCR. The mRNA levels were normalized to GAPDH and amplified by a factor of 106. In comparison to cells ex vivo, the collagen type I to collagen type II mRNA ratio is increased, especially in ACT chondrocytes. Statistically significant differences (p < 0.05) are marked by asterisks (*).
Figure 3
Figure 3
Gene expression pattern of chondrocytes after first passage (P1). Chondrocytes from cartilage of osteoarthritis (OA) patients (n = 18, black bars) were subcultured in a first passage and further expanded until they reached confluence after an additional 12 to 14 days. The gene expression patterns were enumerated by qRT-PCR for type I and II collagen (CI and CII, respectively), aggrecan (AGG), IL-1β and activin-like kinase (ALK)-1 as indicated. The mRNA levels were normalized to GAPDH and amplified by a factor of 106. The ratio of type I to type II collagen mRNA levels continue to increase in P1 OA chondrocytes.
Figure 4
Figure 4
In vivo cartilage formation of osteoarthritic chondrocytes seeded on collagen scaffolds. Collagen scaffolds were seeded with human chondrocytes, implanted subcutaneously into SCID mice and harvested after eight weeks. (a,b) On empty scaffolds no cartilage formation occurred, as shown by the absence of dense Safranin O (a) or type II collagen (b) staining. (c,d) On scaffolds seeded with 1 × 10⁶ osteoarthritic chondrocytes from osteoarthritis (OA) donor 1, moderate amounts of cartilage-like proteoglycan (c) and type II collagen (d) containing tissue could be detected. (g,i) However, hardly any type II collagen positive tissue was formed in scaffolds seeded with 1 × 10⁶ chondrocytes from OA donors 2 (g) and 3 (i). (d,f,h,j) Seeding scaffolds at the higher density of 3 × 10⁶ chondrocytes/cm2 resulted in the formation of type II collagen- and proteoglycan-rich cartilage by cells from all three donors in amounts comparable to those produced by (k) 1 × 10⁶ healthy chondrocytes. (l,m) No type I collagen (l) or alkaline phosphatase activitiy (m) could be detected in these tissues. (c-f) OA donor 1, 78 years. (g,h,l) OA donor 2, 68 years. (i,j,m) OA donor 3, 50 years. (k) Healthy donor, 40 years. (a,c,e) Safranin O staining. (b,d,e-k) Type II collagen immunostaining. (m-o) Positive controls (OA cartilage, cartilage-bone interface) for type I (n), type II (o) and alkaline phosphatase activity (insert in (m)). Bar = 250 μm.
Figure 5
Figure 5
Gene expression pattern of chondrocytes after in vivo inoculation in scaffolds. Chondrocytes from healthy donors (n = 3, white bars) and from osteoarthritis (OA) patients (n = 4, black bars) were expanded in primary culture, seeded onto scaffolds and incubated for four days in vitro, followed by implantation for eight weeks subcutaneously in SCID mice. Scaffolds were harvested and RNA was extracted from the cells to investigate the gene expression patterns by qRT-PCR for type I and II collagen (CI and CII, respectively), aggrecan (AGG), IL-1β and activin-like kinase (ALK)-1 as indicated. The mRNA levels were normalized to GAPDH and amplified by a factor of 106. Cells from healthy donors expressed slightly more collagen, but no significant differences in gene expressions or differences in the type I to type II collagen ratio were observed between the ACT versus OA cells. ND, not detectable.

Similar articles

Cited by

References

    1. Hunter W. Of the structures and diseases of articular cartilages. 1743. Clin Orthop Relat Res. 1995;317:3–6. - PubMed
    1. Hunziker EB. Articular cartilage repair: are intrinsic biological constraints undermining this process insuperable? Osteoarthritis Cartilage. 1999;7:15–28. doi: 10.1053/joca.1998.0159. - DOI - PubMed
    1. Brittberg M, Lindahl A, Nilsson A, Ohlsson C, Isaksson O, Peterson L. Treatment of deep cartilage defects in the knee with autologous chondrocyte transplantation. N Engl J Med. 1994;331:889–895. doi: 10.1056/NEJM199410063311401. - DOI - PubMed
    1. Peterson L, Minas T, Brittberg M, Nilsson A, Sjogren Jansson E, Lindahl A. Two- to 9-year outcome after autologous chondrocyte transplantation of the knee. Clin Orthop Relat Res. 2000;374:212–234. doi: 10.1097/00003086-200005000-00020. - DOI - PubMed
    1. Marlovits S, Hombauer M, Tamandl D, Vecsei V, Schlegel W. Quantitative analysis of gene expression in human articular chondrocytes in monolayer culture. Int J Molec Med. 2004;13:281–287. - PubMed

Publication types

MeSH terms