. 2007 Sep;81(18):9623-32.
doi: 10.1128/JVI.00771-07. Epub 2007 Jun 27.

Characterization of the sequence element directing translation reinitiation in RNA of the calicivirus rabbit hemorrhagic disease virus

Affiliations

Characterization of the sequence element directing translation reinitiation in RNA of the calicivirus rabbit hemorrhagic disease virus

Gregor Meyers. J Virol. 2007 Sep.

Abstract

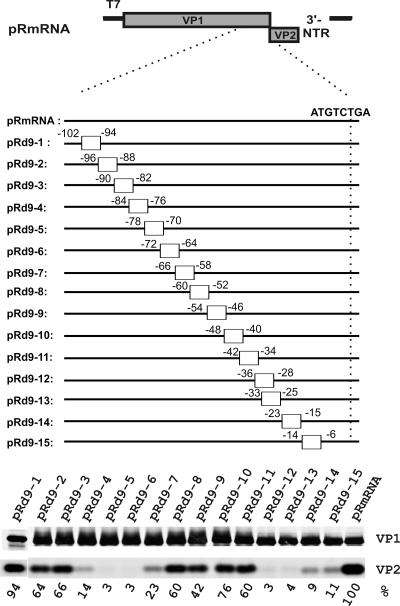
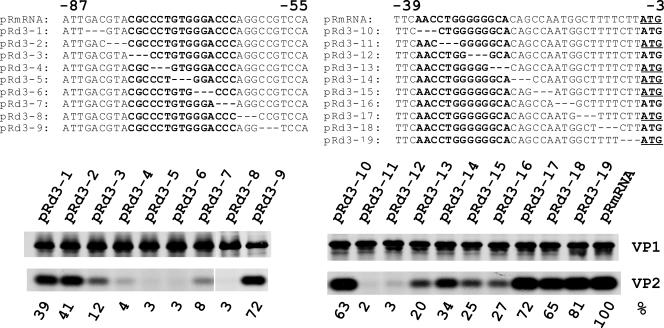
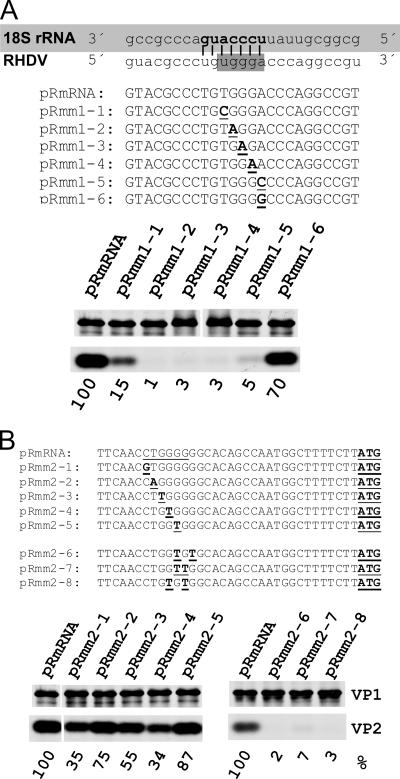
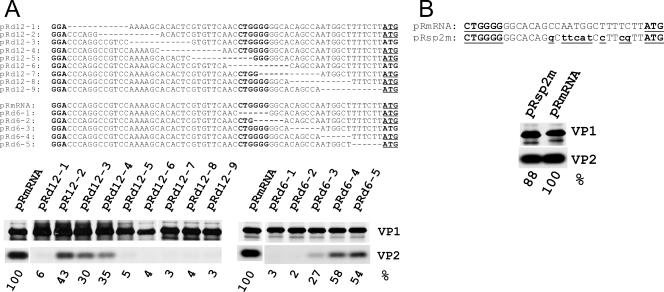
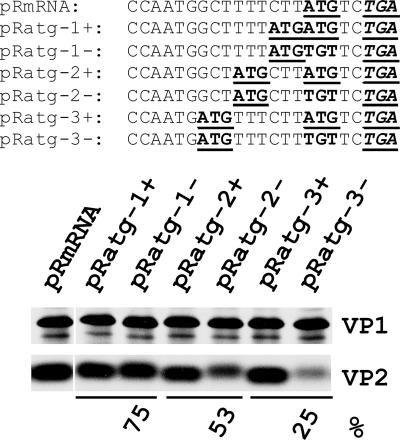
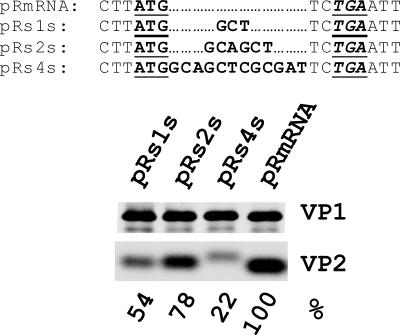
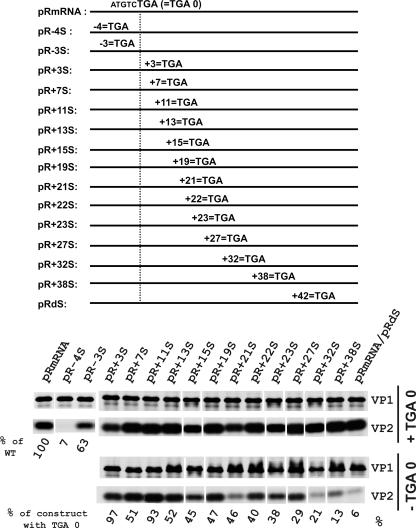
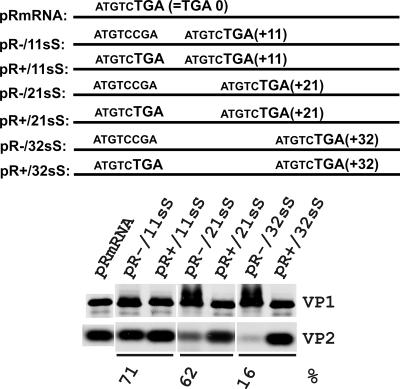
The calicivirus minor capsid protein VP2 is expressed via reinitiation of protein synthesis after termination of translation of the preceding VP1 gene. A sequence element of about 80 nucleotides denoted "termination upstream ribosomal binding site" (TURBS) (25) is crucial for reinitiation. Deletion mapping in the TURBS of a rabbit calicivirus identified two short sequence motifs that were crucial for VP2 expression. Motif 1 is conserved among caliciviruses and is complementary to a sequence in the 18S rRNA. Single-residue exchanges in this motif severely impaired reinitiation when they affected the putative rRNA binding, whereas an exchange preserving complementarity had only a minor effect. Single exchanges in motif 2 were rather well tolerated, but the introduction of double exchanges almost blocked VP2 expression. In contrast, the deletion analyses showed that the RNA between the two motifs is of minor importance. The distance between motif 2 and the start site was found to be important, since deletions of increasing length in this sequence or upstream positioning of the start codon reduced VP2 expression stepwise to low levels, whereas multiple-nucleotide exchanges in this region were tolerated. The low flexibility of the arrangement of TURBS motif 2 and the start codon stand in marked contrast to the requirements with regard to the location of the stop codon of the preceding VP1 gene, which could be moved far downstream with continuous reduction, but without loss, of VP2 translation. The sequence mapping resulted in a refined model of the reinitiation mechanism leading to VP2 expression.


Figures

FIG. 1.
FIG. 1.
Influence of 9-mer deletions in the TURBS region on VP2 expression. On top, a schematic representation of the basic structure of the pRmRNA construct is shown (25) (not drawn to scale). Below, the location of the start stop/site (ATGTCTGA) and the 9-nucleotide deletions (white boxes) in the different mutant constructs are indicated (the numbers refer to the “T” of the ORF1 TGA, indicated by the dotted vertical line). At the bottom, an autoradiograph shows the expression products labeled with 35S amino acids and precipitated with antisera specific for VP1 (upper gel) and VP2 (lower gel). Below the gel, the VP2 expression levels relative to the pRmRNA wt control are given (mean values of at least three independent experiments; the data are normalized relative to the expression levels of VP1). T7, phage T7 promoter; 3′ NTR, 3′ nontranslated region.
FIG. 2.
FIG. 2.
Mapping of the TURBS with 3-nucleotide deletions. The sequence on top represents regions of the 3′-terminal end of ORF1, with the two essential regions determined by the 9-nucleotide deletions written in boldface. The numbers indicate the locations of the sequences with respect to the ORF1 TGA. Below, the positions of 3-nucleotide deletions in the first (left) and second (right) motifs are given. The gels show the proteins precipitated after transient expression, with the calculated VP2 expression efficiencies indicated below the autoradiographs (relative to wt pRmRNA, normalized to the expression level of VP1).
FIG. 3.
FIG. 3.
Effects of mutations in the core regions of the crucial TURBS motifs on VP2 expression. (A) At the top, a part of the rabbit 18S rRNA sequence (nucleotides 1101 to 1125, highlighted in light gray) is given in 3′-5′ orientation. Possible base pairing between the 18S rRNA and the RHDV TURBS motif 1 RNA sequence is indicated by vertical lines. The pentanucleotide conserved among calicivirus sequences is highlighted in gray. Below the RNAs, DNA sequences of the pRmRNA construct and mutants thereof with exchanges in the motif 1 region are given, with the exchanged residues highlighted. Below are gels with the proteins precipitated after transient expression of the indicated constructs. (B) Similar to panel A, with single (left gel) and double (right gel) exchanges in the motif 2 region. In both panels, the calculated VP2 expression efficiencies in percentages are given below the autoradiographs (relative to wt pRmRNA, normalized to the expression levels of VP1).
FIG. 4.
FIG. 4.
Importance of the spacer regions connecting motif 1, motif 2, and the start/stop site. (A) The sequence on top represents the region of the 3′-terminal end of ORF1 starting with the three 3′-terminal residues of the rRNA-complementary part of motif 1 (in boldface) and extending to the AUG (boldface and underlined) of ORF2. The core region of motif 2, as specified by the 3-mer deletions, is also shown in boldface. Below, the positions of 12- and 6-nucleotide deletions are given. The gels show the proteins precipitated after transient expression, with the calculated VP2 expression efficiencies indicated below the autoradiographs (relative to wt pRmRNA, normalized to the expression levels of VP1). (B) Influence of multiple-nucleotide exchanges in the spacer region between motif 2 and the ORF2 start site on VP2 expression. The changed residues are highlighted (lowercase and boldface underlined). The core region of motif 2 is underlined.
FIG. 5.
FIG. 5.
Influence of upstream initiation codons on VP2 expression in the presence (+) or absence (−) of the genuine ORF2 start codon. The genuine or newly generated ATG codons and the ORF1 TGA are highlighted (boldface and underlined). The mutated genuine ATG is shown in boldface but not underlined. Note the in-frame ATG at position −4 already present in the wt sequence (25). The gels below the sequences show the proteins precipitated after transient expression, with the calculated VP2 expression efficiencies of the mutants without genuine ATG indicated below the autoradiographs (relative to the amount of VP2 expressed from the corresponding construct of the + series containing the same upstream ATG, together with the genuine ORF2 ATG).
FIG. 6.
FIG. 6.
Influence of insertions between the ORF2 start and ORF1 stop signals on VP2 expression. ATG and TGA are highlighted (boldface and underlined). The inserted sequence is given in boldface. The gels below the sequences show the proteins precipitated after transient expression, with the calculated VP2 expression efficiencies of the mutants (relative to wt pRmRNA, normalized to the expression levels of VP1).
FIG. 7.
FIG. 7.
Influence of translocation of the ORF1 termination signal on VP2 expression. The scheme on top shows the position of the genuine termination signal (vertical dotted line) and the positions of newly introduced stop codons (not drawn to scale; the numbers indicate the codon positions relative to the genuine stop signal). Note that for all the constructs with new stop codons downstream of the genuine termination site, two versions were established, one with the genuine TGA preserved and one with the TGA replaced by CGA. The gels below the sequences show the proteins precipitated after transient expression of the constructs with the original TGA (upper gels) or with CGA instead (lower gels). The calculated VP2 expression efficiencies of the CGA-containing mutants are indicated below the autoradiographs (relative to the expression level of the corresponding construct from the “+TGA 0” series containing both the original TGA and the new downstream termination signal).
FIG. 8.
FIG. 8.
Influence of complete start/stop site translocations on VP2 expression. The scheme on top shows the positions of the genuine and newly introduced start/stop sites (the numbers indicate the codon positions relative to the genuine stop signal). Note that for all the constructs, two versions were established, one with the genuine TGA preserved (+) and one with the TGA replaced by CGA (−). See the legend to Fig. 7.

Similar articles

Cited by

References

    1. Adhin, M. R., and D. J. van Duin. 1990. Scanning model for translational reinitiation in eubacteria. J. Mol. Biol. 213:811-818. - PubMed
    1. Algire, M. A., and J. R. Lorsch. 2006. Where to begin? The mechanism of translation initiation codon selection in eukaryotes. Curr. Opin. Chem. Biol. 10:480-486. - PubMed
    1. Chaudhry, Y., A. Nayak, M. E. Bordeleau, J. Tanaka, J. Pelletier, G. J. Belsham, L. O. Roberts, and I. G. Goodfellow. 2006. Caliciviruses differ in their functional requirements for eIF4F components. J. Biol. Chem. 281:25315-25325. - PubMed
    1. Clyde, K., and E. Harris. 2006. RNA secondary structure in the coding region of dengue virus type 2 directs translation start codon selection and is required for viral replication. J. Virol. 80:2170-2182. - PMC - PubMed
    1. Daughenbaugh, K. F., C. S. Fraser, J. W. Hershey, and M. E. Hardy. 2003. The genome-linked protein VPg of the Norwalk virus binds eIF3, suggesting its role in translation initiation complex recruitment. EMBO J. 22:2852-2859. - PMC - PubMed

Publication types

MeSH terms

LinkOut - more resources