. 2007 Sep;81(17):9162-74.
doi: 10.1128/JVI.00384-07. Epub 2007 Jun 27.

Quantitative analysis of the binding of simian virus 40 large T antigen to DNA

Affiliations

Quantitative analysis of the binding of simian virus 40 large T antigen to DNA

Amélie Fradet-Turcotte et al. J Virol. 2007 Sep.

Abstract

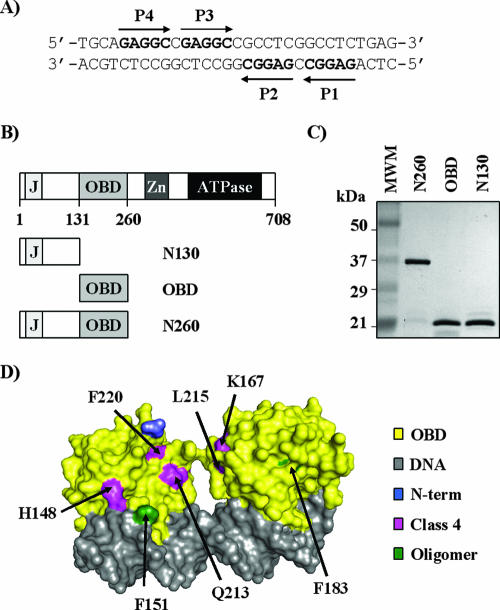
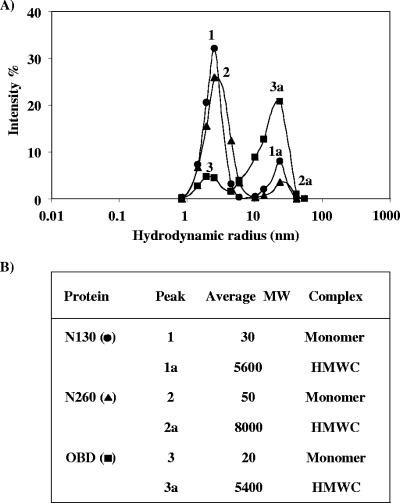
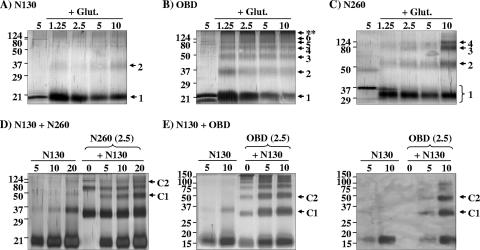
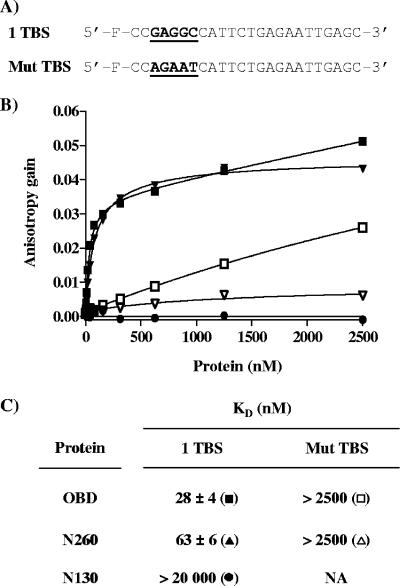
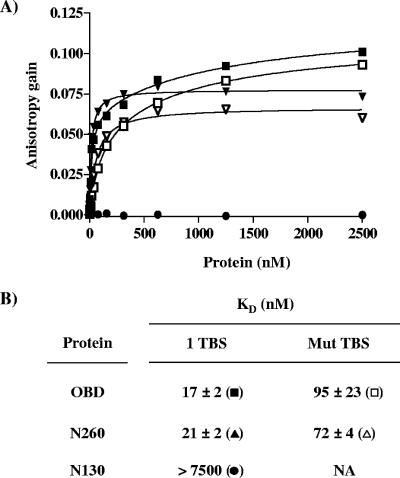
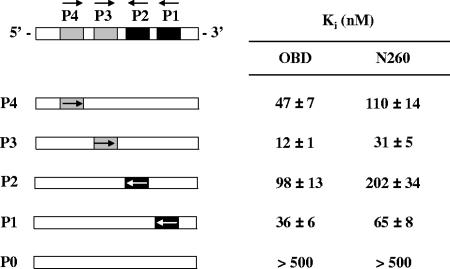
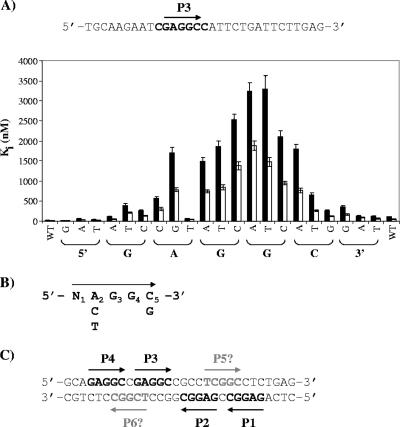
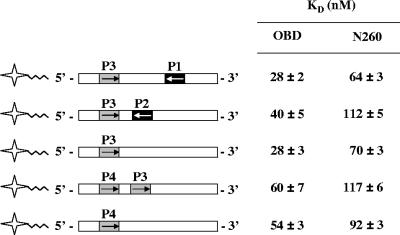
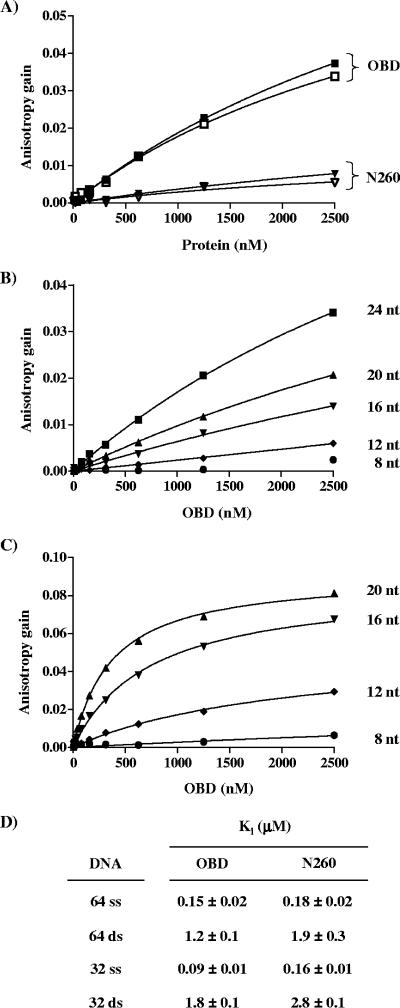
SV40 large T antigen (T-ag) is a multifunctional protein that successively binds to 5'-GAGGC-3' sequences in the viral origin of replication, melts the origin, unwinds DNA ahead of the replication fork, and interacts with host DNA replication factors to promote replication of the simian virus 40 genome. The transition of T-ag from a sequence-specific binding protein to a nonspecific helicase involves its assembly into a double hexamer whose formation is likely dictated by the propensity of T-ag to oligomerize and its relative affinities for the origin as well as for nonspecific double- and single-stranded DNA. In this study, we used a sensitive assay based on fluorescence anisotropy to measure the affinities of wild-type and mutant forms of the T-ag origin-binding domain (OBD), and of a larger fragment containing the N-terminal domain (N260), for different DNA substrates. We report that the N-terminal domain does not contribute to binding affinity but reduces the propensity of the OBD to self-associate. We found that the OBD binds with different affinities to its four sites in the origin and determined a consensus binding site by systematic mutagenesis of the 5'-GAGGC-3' sequence and of the residue downstream of it, which also contributes to affinity. Interestingly, the OBD also binds to single-stranded DNA with an approximately 10-fold higher affinity than to nonspecific duplex DNA and in a mutually exclusive manner. Finally, we provide evidence that the sequence specificity of full-length T-ag is lower than that of the OBD. These results provide a quantitative basis onto which to anchor our understanding of the interaction of T-ag with the origin and its assembly into a double hexamer.


Figures

FIG. 1.
FIG. 1.
Sequence of site II and purified proteins used in this study. (A) Nucleotide sequence of site II located in the SV40 origin of replication. The positions of the four pentanucleotide binding sites, P1 to P4, are indicated. (B) Schematic representation of the 708-aa-long SV40 large T-ag and subfragments thereof used in this study. The following functional domains are shown: J-domain (J; aa 1 to 82), OBD (aa 131 to 260), zinc finger (Zn; aa 302 to 320), and ATPase/helicase domain (aa 418 to 616). (C) Coomassie-stained 15% SDS-PAGE gel of the purified T-ag fragments used in this study. Three-microgram portions of each protein, N260, OBD, and N130, were analyzed. (D) Structure of two OBD molecules bound independently to an oligonucleotide containing P1 and P3 (PDB, 2NTC) (37). Given that P1 and P3 are in opposite orientations, both faces of the OBD can be seen in this structure. Amino acids changed in class 4 mutants (pink) or located at a putative OBD oligomerization interface (green) (37) are indicated. The N-terminal residue of the OBD where the N-terminal domain would be connected is colored in blue.
FIG. 2.
FIG. 2.
DLS analysis of N130, OBD, and N260. (A) The graph represents the scattering intensity (fraction of total scattering) as a function of the hydrodynamic radii obtained for the N130, OBD, and N260 proteins at a concentration of 10 μM. Each curve represents an average of 20 measurements. (B) Molecular weight (MW) and types of complexes estimated from each hydrodynamic radius.
FIG. 3.
FIG. 3.
Glutaraldehyde cross-linking of N130, OBD, and N260. Cross-linking of N130 (A), OBD (B), and N260 (C) was performed using the indicated concentrations (in μM) of each protein. Samples were cross-linked with 0.1% glutaraldehyde (+ Glut.) for 10 min and analyzed by SDS-PAGE and silver staining. For each protein, a reaction performed in the absence of cross-linking agent was used as a control (left lane of each gel). Oligomeric forms of each protein are indicated by arrows on the right of the gels. HMWC formed by the OBD are indicated by asterisks (**). (D) Cross-linking of a mixture of N130 and N260. The three lanes at the left contain the products obtained by cross-linking of N130 at the indicated concentrations. The other lanes contain the products obtained by cross-linking N260, at a constant concentration of 2.5 μM, with increasing concentrations of N130 ranging from 0 to 20 μM. Complexes C1 and C2 correspond in size to heterodimers and heterotetramers, respectively, of N130 and N260. (E) Cross-linking of a mixture of N130 and OBD. Samples were analyzed by silver staining (left panel) and by Western blotting against the His-tagged N130 protein (right panel) with an anti-His tag antibody. The first two lanes contain the products obtained by cross-linking N130 alone at the indicated concentrations. The other lanes contain the products obtained by cross-linking the OBD, at a constant concentration of 2.5 μM, with increasing concentrations of N130 ranging from 0 to 10 μM. Complexes C1 and C2 correspond in size to heterodimers and heterotrimers, respectively, of N130 and OBD. Molecular weights in thousands are indicated to the left of the gels.
FIG. 4.
FIG. 4.
Binding of the N130, OBD, and N260 proteins to DNA measured by fluorescence anisotropy. (A) Probes used in this study. Nucleotide sequences (underlined and in boldface) of the probe containing a single TBS (1 TBS) and of the control nonspecific probe containing a mutated TBS (Mut TBS). (B) Binding isotherms were performed either with the TBS probe (filled symbols) or with the control probe (open symbols) and increasing concentrations of the OBD (squares), N260 (triangles), and N130 (circles) proteins. For each isotherm, 15 nM of duplex DNA probe was incubated with increasing concentrations of N130, OBD, or N260 protein in triplicate. Error bars are not visible on the graph, as they are smaller than the symbols. (C) KD values for the N130, OBD, and N260 proteins for the specific and nonspecific probe were calculated from the data by nonlinear regression and fitting to a one-binding-site equilibrium. The values and standard deviations reported were calculated from over 20 independent binding isotherms, with each data point performed in triplicate.
FIG. 5.
FIG. 5.
Effect of pH and ionic strength on the binding of the OBD and N260 proteins to DNA. (A) Effect of pH. Binding isotherms were performed as described for Fig. 4 but at the lower pH of 6.8. Binding isotherms were performed either with the TBS probe (filled symbols) or with the control probe (open symbols) and increasing concentrations of the OBD (squares), N260 (triangles), and N130 (circles) proteins. (B) KD values for the OBD and N260 for each probe at pH 6.8. Standard deviations were calculated from two independent binding isotherms, with each data point done in triplicate.
FIG. 6.
FIG. 6.
Affinities of the OBD and N260 proteins for each individual pentanucleotide in site II. Schematic representations of site II and competitor DNAs are shown on the left. All competitors contain only one of four pentanucleotides (P1 to P4; 5′-GAGGC-3′). P0 is a competitor in which all four pentanucleotides were mutated to 5′-AGAAT-3′. Arrows represent the direction of the 5′-GAGGC-3′ sequence. Apparent Ki values measured for each competitor DNA are indicated on the right. Ki and standard deviations were calculated from the IC50 of each competitor DNA obtained in triplicate in assays performed at 250 nM of protein and 15 nM of one TBS probe.
FIG. 7.
FIG. 7.
Systematic mutagenesis of P3. (A) Nucleotide sequence of the oligonucleotide containing P3 (indicated by an arrow). Nucleotides shown in bold were systematically changed for all three other nucleotides. The apparent Ki values associated with each change are shown in the bar graph. Apparent Ki and standard deviations were calculated from the IC50 of each competitor DNA obtained in triplicate in assays performed at 250 nM of N260 (filled bars) or OBD (open bars) and 15 nM of one TBS probe. (B) Consensus binding site determined from the data in panel A. (C) Location of two putative novel TBSs (P5 and P6) in site II suggested by the consensus sequence obtained as described above.
FIG. 8.
FIG. 8.
Affinities of the OBD and N260 proteins for pairs of pentanucleotides. Schematic representations of the 24-bp probes used in this analysis are shown on the left. KD values for the OBD and N260 were obtained from the titration of the given probe with each of the proteins and are reported on the right. Binding reactions were performed as described for Fig. 4. Standard deviations were calculated from two independent binding isotherms, with each data point done in triplicate.
FIG. 9.
FIG. 9.
Binding affinity of wild-type OBD and N260 for ssDNA. (A) Binding isotherms obtained with ssDNA probes either containing (filled symbols) or lacking (open symbols) a 5′-GAGGC-3′ sequence and with the indicated protein. (B and C) Binding isotherms generated from the binding of the OBD to ssDNA probes of the indicated length (in nucleotides [nt]) at pH 7.4 (B) or pH 6.8 (C). (D) Apparent Ki values for single-stranded and double-stranded nonspecific DNA competitors of the indicated lengths against the OBD and N260 proteins. Ki and standard deviations were calculated from the IC50 of each competitor DNA obtained in triplicate with assays performed with 250 nM of protein and 15 nM of one TBS probe.
FIG. 10.
FIG. 10.
Binding of full-length T-ag to DNA measured by fluorescence anisotropy. Binding isotherms of full-length T-ag (squares) by use of a 24-bp probe containing (filled symbols) or lacking (open symbols) a single TBS and performed in the absence (A) or presence (B) of 4 mM AMP-PNP and 7 mM MgCl2. In panel A, binding isotherms generated with the N260 protein (circles) under the same conditions are shown in gray for comparison. Binding isotherms were performed in duplicate.

Similar articles

Cited by

References

    1. Alexandrov, A. I., M. R. Botchan, and N. R. Cozzarelli. 2002. Characterization of simian virus 40 T-antigen double hexamers bound to a replication fork. The active form of the helicase. J. Biol. Chem. 277:44886-44897. - PubMed
    1. Barbaro, B. A., K. R. Sreekumar, D. R. Winters, A. E. Prack, and P. A. Bullock. 2000. Phosphorylation of simian virus 40 T antigen on Thr 124 selectively promotes double-hexamer formation on subfragments of the viral core origin. J. Virol. 74:8601-8613. - PMC - PubMed
    1. Baur, C. P., K. Klausing, M. Scheffner, H. Stahl, and R. Knippers. 1988. Protein-DNA interactions at the simian virus 40 origin of replication. Biochim. Biophys. Acta 951:388-395. - PubMed
    1. Bochkareva, E., D. Martynowski, A. Seitova, and A. Bochkarev. 2006. Structure of the origin-binding domain of simian virus 40 large T antigen bound to DNA. EMBO J. 25:5961-5969. - PMC - PubMed
    1. Borowiec, J. A., F. B. Dean, P. A. Bullock, and J. Hurwitz. 1990. Binding and unwinding—how T antigen engages the SV40 origin of DNA replication. Cell 60:181-184. - PubMed

Publication types

MeSH terms

LinkOut - more resources