. 2007 Sep;98(3):1083-101.
doi: 10.1152/jn.00332.2007. Epub 2007 Jun 27.

Quantal and nonquantal transmission in calyx-bearing fibers of the turtle posterior crista

Affiliations

Quantal and nonquantal transmission in calyx-bearing fibers of the turtle posterior crista

Joseph C Holt et al. J Neurophysiol. 2007 Sep.

Abstract

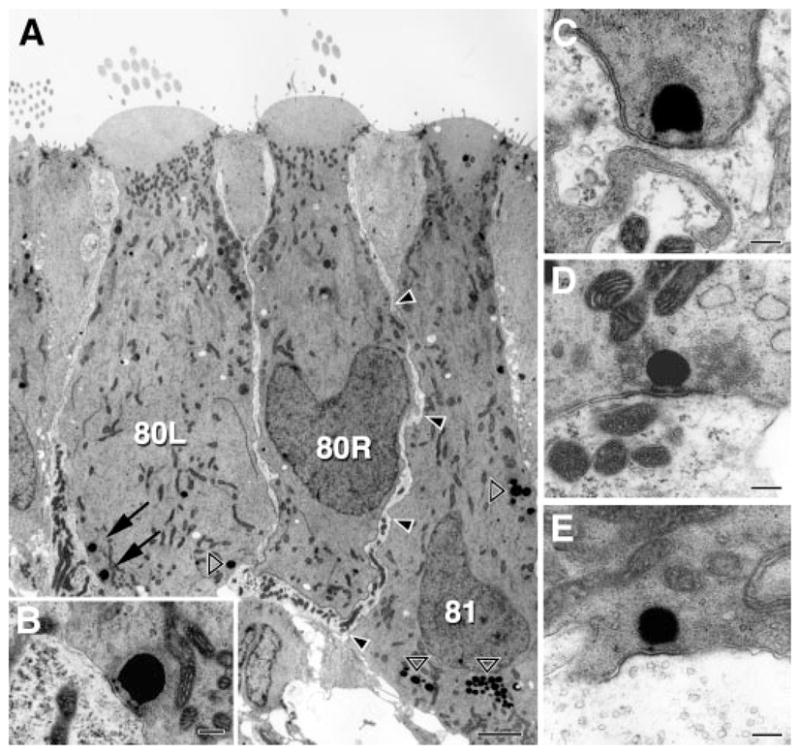
Intracellular recordings were made from nerve fibers in the posterior ampullary nerve near the neuroepithelium. Calyx-bearing afferents were identified by their distinctive efferent-mediated responses. Such fibers receive inputs from both type I and type II hair cells. Type II inputs are made by synapses on the outer face of the calyx ending and on the boutons of dimorphic fibers. Quantal activity, consisting of brief mEPSPs, is reduced by lowering the external concentration of Ca2+ and blocked by the AMPA-receptor antagonist CNQX. Poisson statistics govern the timing of mEPSPs, which occur at high rates (250-2,500/s) in the absence of mechanical stimulation. Excitation produced by canal-duct indentation can increase mEPSP rates to nearly 5,000/s. As the rate increases, mEPSPs can change from a monophasic depolarization to a biphasic depolarizing-hyperpolarizing sequence, both of whose components are blocked by CNQX. Blockers of voltage-gated currents affect mEPSP size, which is decreased by TTX and is increased by linopirdine. mEPSP size decreases severalfold after impalement. The size decrease, although it may be triggered by the depolarization occurring during impalement, persists even at hyperpolarized membrane potentials. Nonquantal transmission is indicated by shot-noise calculations and by the presence of voltage modulations after quantal activity is abolished pharmacologically. An ultrastructural study shows that inner-face inputs from type I hair cells outnumber outer-face inputs from type II hair cells by an almost 6:1 ratio.


Figures

FIG. 1
FIG. 1
Spectral and shot-noise calculations provide accurate estimates of quantal parameters over most of the parameter space. Simulations of quantal records, each 1.39 s long; 10 simulations were run for each set of parameters (●). Input parameters (abscissa; mean values, —) and output parameters (ordinate; mean values, ○). AD: estimates of quantal duration (qdur), size (qsize), rate (qrate), and depolarization for 4 different values of mean qsize (0.05, 0.1, 0.2, and 0.4 mV). Other parameters: qdur = 2.71 ms, qrate = 500/s. qsizes were selected from a gamma distribution with a coefficient of variation (CV) = 0.4. EH: estimates of the same quantal parameters for qrates of 200, 500, 1,000, 2,000, 4,000, and 8,000/s. In F, medians (✶) are also shown. Mean qsize = 0.2 mV. Other parameters as in AD.
FIG. 2
FIG. 2
Calyx-bearing (CD) units can be identified by their response to electrical stimulation of efferent fibers and their activity characterized in the absence and presence of canal-duct indentation. A and B: response to 20 shocks, 200/s, delivered to efferent fibers in the cross-bridge interconnecting the anterior and posterior vestibular nerves. Average depolarizing response to 11 consecutive trials (A) and an individual response (B) to show that quantal activity is unaffected by efferent excitation. Spikes are seen at the peaks of the excitatory postsynaptic potentials (EPSPs) in both records. C: indenter stimulation, 0.3 Hz, peak amplitudes, about ±90 μm; no stimulus (Rest), inhibitory (Inh), and excitatory (Exc) stimulation. DF: records include 3 s of rest followed by slightly over 2 cycles of stimulation. D was taken within the first minute after impalement. E and F: unfiltered and filtered versions, respectively, of activity recorded at a point 10 min after impalement and 7 min after the application of tetrodotoxin (TTX).
FIG. 3
FIG. 3
Quantal activity in CD units is modulated by mechanical stimulation and conforms to Poisson statistics. Data are from the same CD unit as in Fig. 2. A: 200-ms samples of activity during rest (middle), inhibition (bottom), and excitation (top). Individual miniature mEPSPs are seen during inhibition (arrows) and similarly shaped events overlap at higher quantal rates during rest and excitation. B: each of the 12 waves of the indenter response was divided into 3 parts based on whether quantal variance was high, medium, or low. mEPSPs were obtained from the high (Excitation) and low thirds (Inhibition) by Wiener filtering. Two sets of mEPSPs (excitation, n = 1,588; inhibition, n = 166) were averaged for all 12 waves and the 2 average mEPSPs were each normalized to unity amplitude. Quantal durations (qdur) are similar because in this particular unit sinusoidal modulations of qdur and quantal variance were 90° apart, not 180° apart as was typical of the entire population. C: interevent-interval histogram (bars) of mEPSPs detected by deconvolution and its fit by an exponential distribution (line) expected for a Poisson process. A total of 1,142 events were detected with a detection threshold of 0.125 mV in a 5-s sample, equivalent to a quantal rate, qrate = 228/s. Lack of short intervals reflects the inability of the deconvolution algorithm to detect intervals <1 ms. Exponential fit predicts that there were 1,928 events (qrate = 386/s), close to that predicted from shot-noise analysis (qrate = 364/s).
FIG. 4
FIG. 4
Neurotransmission in CD afferents is diminished in low concentrations of external Ca2+ and involves non–N-methyl-D-aspartate (non-NMDA) receptors. All traces are high-pass filtered records of resting activity followed by the response to 0.3-Hz indentations. A: transmission was almost completely blocked in a CD unit when the control solution (top) was replaced by a low-Ca2+ solution for several minutes (middle) and showed a partial return after the control solution was returned for several minutes (bottom). Variance, after subtraction of the residual variance, was reduced from the top to the middle record by 100% during rest and by 92% during peak excitation. Washing resulted in a return of the variance relative to control of 30% (rest) and 51% (maximal excitation). B: quantal activity in another CD unit is nearly abolished when the α-amino-3-hydroxy-5-methyl-4-isoxazolepropionic acid (AMPA)–receptor blocker 6-cyano-7-nitroquinoxaline-2,3-dione (CNQX) was added to the control solution. Top: control record. Middle: CNQX was added immediately before this trial and begins to progressively block transmission. Bottom: transmission is almost completely blocked about 1 min after the end of the middle record. Calibrations: 0.5 mV, 1 s (A); 0.5 mV, 5 s (B).
FIG. 5
FIG. 5
Quantal shape can be estimated by spectral and deconvolution methods. Data are from a CD unit. A: power spectrum of resting activity (○) is fit by Eq. 1 with a rate constant α = 920/s (—), and an exponent fixed at k = 2. B: deconvolution identified individual mEPSPs, of which every fourth example is shown (thin lines), as well as the average mEPSP based on 245 individual examples (black line). C: power spectrum in A was used to calculate a spectral mEPSP from Eq. 2 (- - - -), which is similar to the average deconvolution mEPSP (—), also seen in B. The two mEPSPs were normalized to peaks of unity.
FIG. 6
FIG. 6
Some CD units show a midfrequency enhancement in their resting power spectrum and a biphasic, depolarizing– hyperpolarizing mEPSP. A: resting power spectrum (○) of a CD unit has a peak near 70 Hz and a power ratio between 70 and 7 Hz of 6.2. Equation 1 (Alpha) gives a poor fit, whereas a better fit is obtained on multiplying Eqs. 1 and 1a (Lead-lag). B: 3 time curves: the deconvolution mEPSP, the spectral mEPSPs based on the alpha, and lead-lag fits in A. Horizontal lines indicate the 95% confidence interval about zero.
FIG. 7
FIG. 7
Quantal parameters, including mEPSP duration, size, and rate vary during sinusoidal mechanical stimulation of CD units. Sinusoidal indenter cycles were divided into 24 segments of 15° width. Data from corresponding segments in the middle 10 of 12 cycles were averaged. Points for an individual unit (●) are fit by sine waves (solid lines). Also included are sine-wave fits based on the entire sample of 16 CD units (dashed lines). A: from spectral analyses, mEPSP shapes deduced for each segment were integrated to provide estimates of quantal duration. B: Eq. 5 was used to deduce quantal size. C: Eq. 6 provided quantal-rate estimates; only the excitatory half-cycles were fit. Arrows indicate peak excitatory indentation at 270°.
FIG. 8
FIG. 8
Voltage modulation (T) in CD units can be decomposed into quantal (Q) and nonquantal (NQ) components. A: unfiltered response of a CD unit to 6 cycles of a 0.3-Hz sinusoidal indentation, one-sided amplitude of 106 μm. B: high-pass filtered record of the same response eliminated sinusoidal voltage modulation, but preserved high-frequency (quantal) activity. C: data for the middle 4 of the 6 cycles in A and B are averaged into single-cycle histograms, 24 bins/cycle. Downward arrowheads in C and D, maximum excitatory indentation. Total (T) is an empirical average; quantal (Q) is calculated from Eq. 7; nonquantal (NQ), difference between T and Q. Excitatory half-cycles fit by half-wave sinusoids. D: single-cycle histograms from another unit in which there is a nonquantal (NQ) response in the absence of a quantal (Q) response. NQ was intrinsic to the fiber as extracellular control records were flat (see Holt et al. 2006b for discussion).
FIG. 9
FIG. 9
Nonquantal response persists even as quantal transmission is blocked pharmacologically. A: unfiltered voltage (Mean, top trace) and the high-pass variance (Variance, bottom trace) are plotted during the response to 6 cycles of a 0.3-Hz sinusoidal indentation (one-sided amplitude, 46 μm). Mean, variance, and skew (the latter not shown) were calculated from consecutive samples of 0.139-s duration (1/24th of a 0.3-Hz sine-wave period) throughout the record. CNQX + AP-5 were introduced before the trial. There is a much larger reduction in the variance modulation than in the mean modulation. B: sinusoidal fits were obtained for each excitatory half-cycle in this and the subsequent trial. Peak excitatory skew is plotted against the peak excitatory variance cycle by cycle for the 12 cycles. Points are fit by a power law with an exponent near 1.5, consistent with a variation in quantal size (qsize). C: cycle-by-cycle excitatory voltage modulation is plotted for the same 12 points as in B vs. the square root of the peak variance, the latter a measure of qsize. A linear fit indicates that much of the total modulation is still present when qsize is extrapolated to zero.
FIG. 10
FIG. 10
Quantal size in CD units declines after impalement. A: unfiltered record from a CD unit begins shortly after impalement. There is a burst of action potentials whose rapid decline may be partly attributable to the diffusion of QX-314 out of the microelectrode. B: a high-gain, high-pass filtered record shows that after the spike burst there is a decline in quantal variance. Large transients are artifacts resulting from shock trains delivered to efferent fibers. C: as the variance (corrected for residual variance) declines, there is a concurrent decline in skew. Skew vs. variance relation is fit by a power law (not shown). Quantal size (qsize) is calculated from Eq. 5. D: efferent response amplitudes are plotted as a function of the square root of variance, which should be proportional to qsize, for this and 2 other units. Inset: example of the efferent response for this unit (calibrations, 0.2 mV, 0.2 s). There is a near constancy of the efferent responses in the face of a large decline in qsize.
FIG. 11
FIG. 11
TTX suppresses quantal transmission in CD units. A: TTX was applied before the start of the trial, consisting of 12 waves of a 0.3-Hz sinusoidal indentation. There is a hyperpolarization and a reduction in quantal variance with little decline in the sinusoidal voltage modulation. B: skew–variance relation is fit by a power law with an exponent near 1.5. C: amplitude of the excitatory modulation of membrane voltage is plotted vs. the square root of the peak excitatory variance; the latter should be proportional to quantal size (qsize). A linear fit when extrapolated to zero variance indicates the presence of a nonquantal component. Other details as in Fig. 9.
FIG. 12
FIG. 12
K+-channel blockers enhance synaptic transmission in CD units. A and B: low-pass records (top) and high-pass filtered records (bottom) before (A) and during (B) application of linopirdine. Blocker increased quantal activity. Spikes, which had disappeared long before the control record, reappeared; they were digitally removed from the record; their times of occurrence are indicated by marks under the high-pass record in B. Calibrations apply to both A and B. C: EPSPs deduced from spectral analyses of excitatory peaks. Linopirdine resulted in an increase in qsize and qdur (D), but not in qrate (E). Drug applied between trials 0 and 1 (D, E). Linopirdine records (B, C), trial 5.
FIG. 13
FIG. 13
Three classes of afferent synapses. Electron micrographs from the central zone of a turtle posterior crista. A: 2 type I hair cells (80L, 80R) are innervated by a single calyx ending, whereas a type II hair cell (81) makes a long apposition (arrowheads) with the calyx ending. Two synapses are seen in cell 80L (arrows), of which the bottom one is shown at high magnification in B. Other dark, circular structures are lipid bodies (open arrowheads). BE: synapses in type I hair cells (B, C) and in type II hair cells contacting an afferent bouton (D) and the outer face of a calyx ending (E). Scale bars: 2 μm (A) and 200 nm (BE).

References

    1. Baird IL. Anatomical features of the inner ear in submammalian vertebrates. In: Keidel WD, Neff WD, editors. Handbook of Sensory Physiology. Berlin: Springer-Verlag; 1974. pp. 159–212.
    1. Baird RA, Desmadryl G, Fernández C, Goldberg JM. The vestibular nerve of the chinchilla. II. Relation between afferent response properties and peripheral innervation patterns in the semicircular canals. J Neurophysiol. 1988;60:182–203. - PubMed
    1. Bao H, Wong WH, Goldberg JM, Eatock RA. Voltage-gated calcium channel currents in type I and type II hair cells isolated from the rat crista. J Neurophysiol. 2003;90:155–164. - PubMed
    1. Behrend O, Schwark C, Kunihiro T, Strupp M. Cyclic GMP inhibits and shifts the activation curve of the delayed-rectifier (IK1) of type I mammalian vestibular hair cells. Neuroreport. 1997;8:2687–2690. - PubMed
    1. Boettger T, Hubner CA, Maier H, Rust MB, Beck FX, Jentsch TJ. Deafness and renal tubular acidosis in mice lacking the K-Cl co-transporter KCC4. Nature. 2002;416:874–878. - PubMed

Publication types

MeSH terms

Substances

LinkOut - more resources