

Three-dimensional architecture of presynaptic terminal cytomatrix
- PMID: 17596435
- PMCID: PMC6672225
- DOI: 10.1523/JNEUROSCI.1773-07.2007
Three-dimensional architecture of presynaptic terminal cytomatrix
Abstract
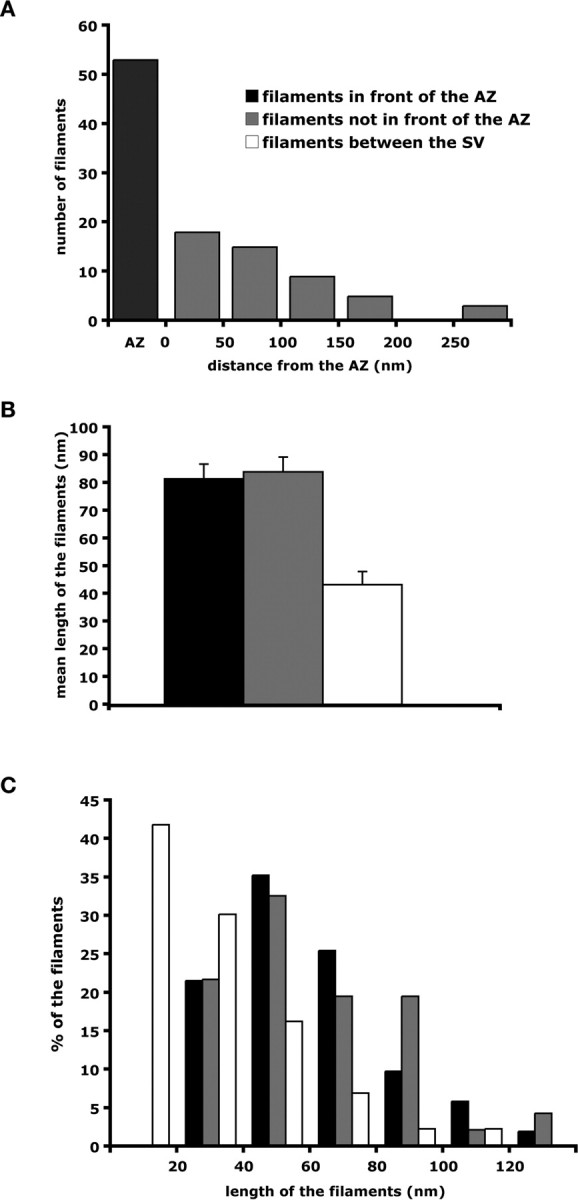
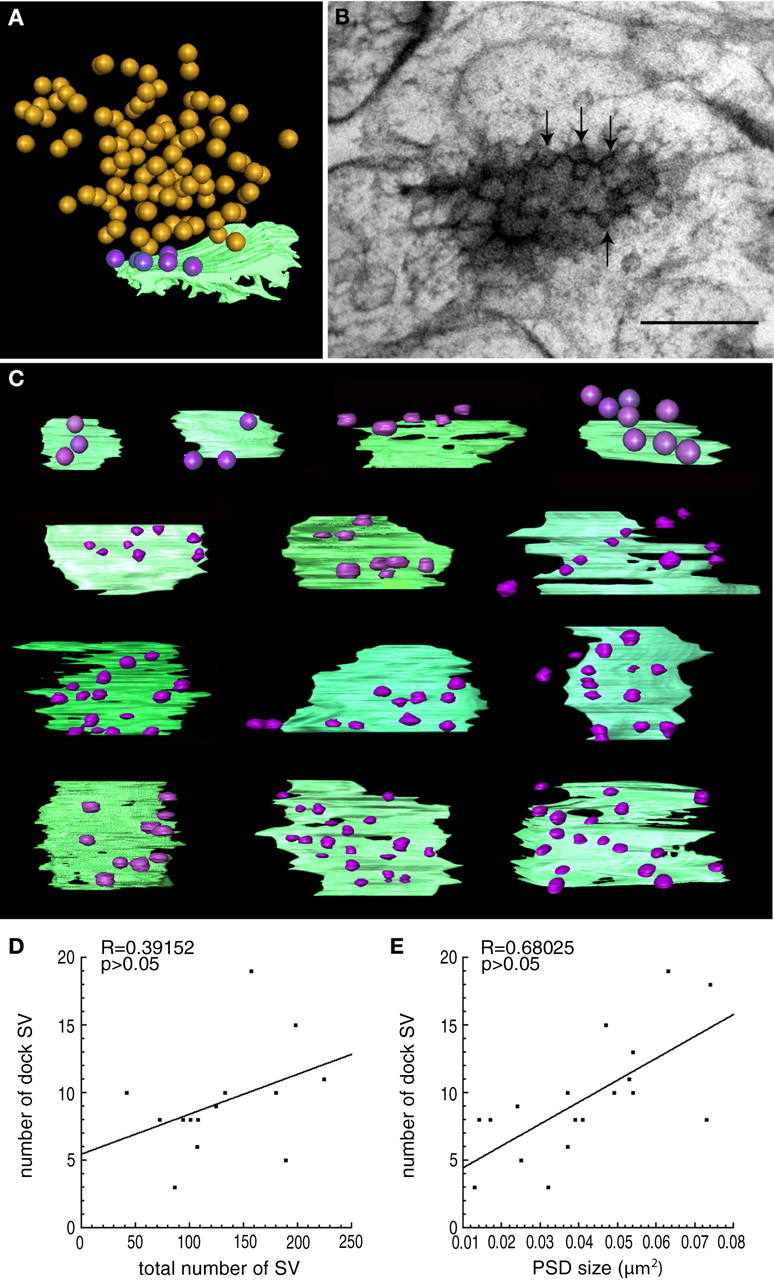
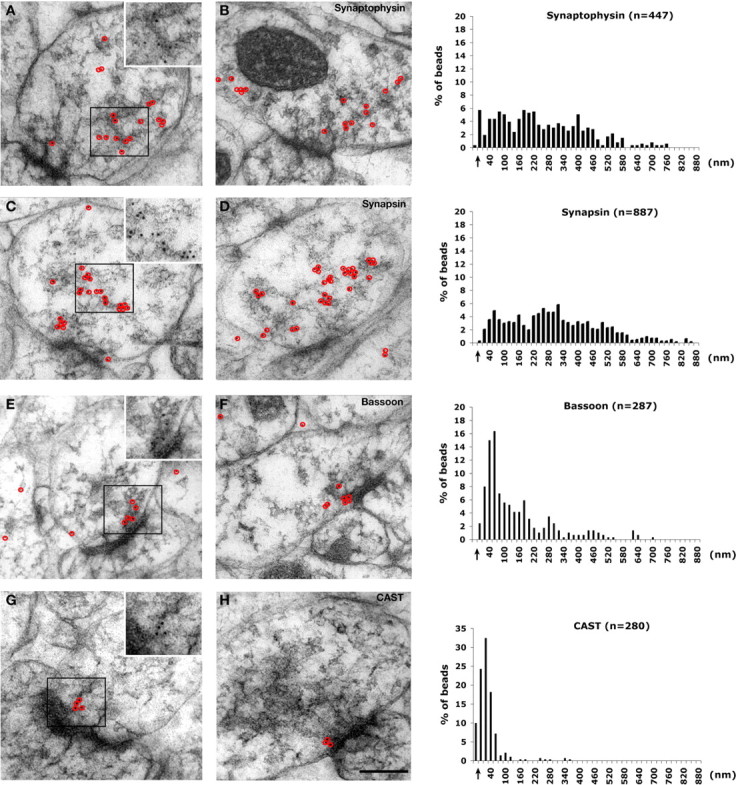
Presynaptic terminals are specialized for mediating rapid fusion of synaptic vesicles (SVs) after calcium influx. The regulated trafficking of SVs likely results from a highly organized cytomatrix. How this cytomatrix links SVs, maintains them near the active zones (AZs) of release, and organizes docked SVs at the release sites is not fully understood. To analyze the three-dimensional (3D) architecture of the presynaptic cytomatrix, electron tomography of presynaptic terminals contacting spines was performed in the stratum radiatum of the rat hippocampal CA1 area. To preserve the cytomatrix, hippocampal slices were immobilized using high-pressure freezing, followed by cryosubstitution and embedding. SVs are surrounded by a dense network of filaments. A given vesicle is connected to approximately 1.5 neighboring ones. SVs at the periphery of this network are also linked to the plasma membrane, by longer filaments. More of these filaments are found at the AZ. At the AZ, docked SVs are grouped around presynaptic densities. Filaments with adjacent SVs emerge from these densities. Immunogold localizations revealed that synapsin is located in the presynaptic bouton, whereas Bassoon and CAST (ERC2) are at focal points next to the AZ. In synapsin triple knock-out mice, the number of SVs is reduced by 63%, but the size of the boutons is reduced by only 18%, and the mean distance of SVs to the AZ is unchanged. This 3D analysis reveals the morphological constraints exerted by the presynaptic molecular scaffold. SVs are tightly interconnected in the axonal bouton, and this network is preferentially connected to the AZ.
Figures


Similar articles
-
Functional regions of the presynaptic cytomatrix protein bassoon: significance for synaptic targeting and cytomatrix anchoring.Mol Cell Neurosci. 2003 Jun;23(2):279-91. doi: 10.1016/s1044-7431(03)00015-0. Mol Cell Neurosci. 2003. PMID: 12812759
-
Changes in the distribution of calcium calmodulin-dependent protein kinase II at the presynaptic bouton after depolarization.Brain Cell Biol. 2006 Jun;35(2-3):117-24. doi: 10.1007/s11068-007-9012-5. Epub 2007 Sep 20. Brain Cell Biol. 2006. PMID: 17957478
-
Synaptic vesicle dynamics in the mossy fiber-CA3 presynaptic terminals of mouse hippocampus.Neurosci Res. 2007 Dec;59(4):481-90. doi: 10.1016/j.neures.2007.08.019. Epub 2007 Sep 12. Neurosci Res. 2007. PMID: 17933408
-
Molecular organization and plasticity of the cytomatrix at the active zone.Curr Opin Neurobiol. 2012 Jun;22(3):423-30. doi: 10.1016/j.conb.2011.10.005. Epub 2011 Oct 24. Curr Opin Neurobiol. 2012. PMID: 22030346 Review.
-
Synapsins and the Synaptic Vesicle Reserve Pool: Floats or Anchors?Cells. 2021 Mar 16;10(3):658. doi: 10.3390/cells10030658. Cells. 2021. PMID: 33809712 Free PMC article. Review.
Cited by
-
The structure and function of 'active zone material' at synapses.Philos Trans R Soc Lond B Biol Sci. 2015 Jul 5;370(1672):20140189. doi: 10.1098/rstb.2014.0189. Philos Trans R Soc Lond B Biol Sci. 2015. PMID: 26009768 Free PMC article. Review.
-
An Exclusion Zone for Ca2+ Channels around Docked Vesicles Explains Release Control by Multiple Channels at a CNS Synapse.PLoS Comput Biol. 2015 May 7;11(5):e1004253. doi: 10.1371/journal.pcbi.1004253. eCollection 2015 May. PLoS Comput Biol. 2015. PMID: 25951120 Free PMC article.
-
Non-microtubule tubulin-based backbone and subordinate components of postsynaptic density lattices.Life Sci Alliance. 2021 May 18;4(7):e202000945. doi: 10.26508/lsa.202000945. Print 2021 Jul. Life Sci Alliance. 2021. PMID: 34006534 Free PMC article.
-
Cryo-electron tomography reveals a critical role of RIM1α in synaptic vesicle tethering.J Cell Biol. 2013 May 27;201(5):725-40. doi: 10.1083/jcb.201206063. J Cell Biol. 2013. PMID: 23712261 Free PMC article.
-
α-Synuclein in synaptic function and dysfunction.Trends Neurosci. 2023 Feb;46(2):153-166. doi: 10.1016/j.tins.2022.11.007. Epub 2022 Dec 23. Trends Neurosci. 2023. PMID: 36567199 Free PMC article. Review.
References
-
- Abramoff MD, Magelhaes PJ, Ram SJ. Image processing with ImageJ. Biophotonics Int. 2004;11:36–42.
-
- Altrock WD, tom Dieck S, Sokolov M, Meyer AC, Sigler A, Brakebusch C, Fassler R, Richter K, Boeckers TM, Potschka H, Brandt C, Loscher W, Grimberg D, Dresbach T, Hempelmann A, Hassan H, Balschun D, Frey JU, Brandstatter JH, Garner CC. Functional inactivation of a fraction of excitatory synapses in mice deficient for the active zone protein bassoon. Neuron. 2003;37:787–800. - PubMed
-
- Cases-Langhoff C, Voss B, Garner AM, Appeltauer U, Takei K, Kindler S, Veh RW, De Camilli P, Gundelfinger ED, Garner CC. Piccolo, a novel 420 kDa protein associated with the presynaptic cytomatrix. Eur J Cell Biol. 1996;69:214–223. - PubMed
-
- Chi P, Greengard P, Ryan TA. Synapsin dispersion and reclustering during synaptic activity. Nat Neurosci. 2001;4:1187–1193. - PubMed
Publication types
MeSH terms
Substances
Grants and funding
LinkOut - more resources
Full Text Sources
Other Literature Sources
Miscellaneous