. 2007 Jun 27;27(26):6892-902.
doi: 10.1523/JNEUROSCI.0445-07.2007.

Neural interpretation of blood oxygenation level-dependent fMRI maps at submillimeter columnar resolution

Affiliations

Neural interpretation of blood oxygenation level-dependent fMRI maps at submillimeter columnar resolution

Chan-Hong Moon et al. J Neurosci. .

Abstract

Whether conventional gradient-echo (GE) blood oxygenation-level-dependent (BOLD) functional magnetic resonance imaging (fMRI) is able to map submillimeter-scale functional columns remains debatable mainly because of the spatially nonspecific large vessel contribution, poor sensitivity and reproducibility, and lack of independent evaluation. Furthermore, if the results from optical imaging of intrinsic signals are directly applicable, regions with the highest BOLD signals may indicate neurally inactive domains rather than active columns when multiple columns are activated. To examine these issues, we performed BOLD fMRI at a magnetic field of 9.4 tesla to map orientation-selective columns of isoflurane-anesthetized cats. We could not convincingly map orientation columns using conventional block-design stimulation and differential analysis method because of large fluctuations of signals. However, we successfully obtained GE BOLD iso-orientation maps with high reproducibility (r = 0.74) using temporally encoded continuous cyclic orientation stimulation with Fourier data analysis, which reduces orientation-nonselective signals such as draining artifacts and is less sensitive to signal fluctuations. We further reduced large vessel contribution using the improved spin-echo (SE) BOLD method but with overall decreased sensitivity. Both GE and SE BOLD iso-orientation maps excluding large pial vascular regions were significantly correlated to maps with a known neural interpretation, which were obtained in contrast agent-aided cerebral blood volume fMRI and total hemoglobin-based optical imaging of intrinsic signals at a hemoglobin iso-sbestic point (570 nm). These results suggest that, unlike the expectation from deoxyhemoglobin-based optical imaging studies, the highest BOLD signals are localized to the sites of increased neural activity when column-nonselective signals are suppressed.


Figures

Figure 1.
Figure 1.
Schematics for spatial profiles of fMRI signals in response to 0° orientation stimulation when multiple 0° iso-orientation columns are activated. BOLD signal (red lines) depends on changes in dHb amounts resulting from alterations in CMRO2 (green lines) and CBF (blue lines) in response to increased neuronal activity (white regions). If a CBF PSF is rather narrow (solid blue line) and/or if the amplitude difference between active and inactive columns for CBF is much larger than that for CMRO2 response, the highest change of the BOLD signal (solid red line) will mark the sites of increased neural activity. In contrast, if the CBF response is rather broad or has relatively small amplitude difference between active and inactive columns (dashed blue line), the highest change of the BOLD signal (dashed red line) could mark the sites of no neural activity as seen in dHb-weighted OIS and dHb signals obtained from optical spectroscopy during the hyperoxygenated phase. Thus, the assignment of orientation preference to BOLD fMRI maps is dependent on both PSF and magnitude of CBF responses. CBV PSF may be similar to or a little broader than CBF PSF, but that is not shown here.
Figure 2.
Figure 2.
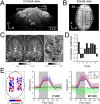
Slice selection for functional imaging and block-design BOLD fMRI results. A, Coronal view (thickness, 1 mm) reconstructed from 3-D venogram data. From the 3-D venogram, a 1-mm-thick slice (white rectangle) was selected for functional imaging studies. B, Dorsal view of the 1-mm-thick slice selected in A. Black dashed rectangles excluding edges of the brain are chosen as ROIs for the subsequent analysis. Either black or white dashed contours roughly trace the boundary between the brain and background and are used for images in B, C, and E and in Figures 4 A, 6 A–D, and 7 A. C, Left to right, Single-condition maps of 0 and 90° stimulation and differential map of 0 versus 90° stimulation. Black arrowheads indicate the draining vessel artifacts in the single-condition maps, and white arrowheads indicate the remaining draining artifacts in the differential map. D, Pixel-wise correlation coefficients between the averaged differential map over 10 cycles and differential maps of an individual cycle within two rectangles shown in B. The dashed horizontal line indicates the mean correlation value in noise area (0.32 ± 0.05; n = 10 cycles). E, Left, Mask image of activation pixels for 0 and 90° stimulation. Blue and red pixels correspond to 0 and 90° activation ROIs, respectively, within the rectangles in B; pixels with values of top 25% and bottom 25% were assigned to 0 and 90° activation ROIs. Middle and right, BOLD responses to 0° (blue traces) and 90° (red traces) stimulation are plotted from 0 and 90° ROIs as a function of time; their differential signals (green traces) are also shown. Each cycle's response was normalized with the average for 5 s prestimulus baseline, and 10 cycles were averaged. Stimulation was applied for 10 s (gray area). For clarity, only one-side error bars indicating 1 SD are shown. D, Dorsal; R, right; A, anterior; LS, lateral sulcus; SSPL, suprasplenial sulcus; SPL, splenial sulcus; mg, marginal gyrus; ML, midline. These abbreviations are used in subsequent figures.
Figure 3.
Figure 3.
Improved sensitivity of orientation-specific BOLD signal with temporally encoded continuous stimulation. Data were obtained from the same cat shown in Figure 2. A, Time courses over 10 cycles obtained from a whole brain imaging area (black trace) and from a 3 × 3 pixel ROI (469 × 469 μm2) indicated by the red square in the inset image before (red) or after (blue) normalization with the global signal (black trace). Inset, A 1-mm-thick MR anatomic image with a red ROI. B, Pixel-wise correlation coefficients between the mean differential map (0–90°) of 10 cycles and differential maps of individual cycles within the ROIs shown in Figure 2 B. C, Averaged time course over 10 cycles of normalized data obtained from the small ROI (red square in the inset image in A). Signals in response to changes in stimulation orientation from 0 to 157.5° (indicated by orientation of black bars) are plotted during one 80 s cycle (blue dots). Data are fitted with a sinusoidal function (brown trace). Left and right y axes are in the unit of arbitrary intensity and percentage change from the mean intensity, respectively. D, Pixel-wise correlation coefficients between the temporally encoded 0° orientation map averaged for 10 cycles and those of individual cycles calculated with Fourier analysis within the ROIs shown in Figure 2 B. The 0° orientation maps were obtained with and without the application of a spatial filer, which did not change the shapes of orientation patches (see supplemental Fig. 1, available at www.jneurosci.org as supplemental material). Dashed lines in B and D indicate mean correlation of maps in noise area. a.u., Arbitrary units.
Figure 4.
Figure 4.
Run-by-run reproducibility of temporally encoded GE BOLD iso-orientation maps. Data were obtained from the same cat shown in Figures 2 and 3. A, Iso-orientation maps of 0° stimulation for three different runs. Each map was presented as orientation-selective signals, ΔS normalized by the mean magnitude of the orientation-specific signals, within the tissue ROI (within yellow and black dashed contours), which is 0.22, 0.20, and 0.22% for each run. Bright and dark regions indicate increases in the orientation-specific BOLD signal during the presentation of 0 and 90° stimulation, respectively. It should be noted that iso-orientation patches in the midline are not likely because of artifacts produced by spatial filtering (see supplemental Fig. 1, available at www.jneurosci.org as supplemental material); because both hemispheres are contacted at the dorsoventral position of the imaging slice (see Fig. 2 A,B), patches in both hemispheres appear as one single contiguous patch in the middle area. B, Scatter plots for 0° iso-orientation signals from first run versus those of the second (red dots) and third (blue dots) runs within the left hemisphere ROI (yellow contour in A). Both correlation coefficients were significantly high (0.78 and 0.87; p < 0.001 for each).
Figure 5.
Figure 5.
Longitudinal reproducibility of temporally encoded GE BOLD iso-orientation maps. A, A comparison of maps was performed 1 week apart. The of the orientation-specific signals were 0.20% for both sessions. Run-by-run reproducibility was 0.88 in the first session and 0.86 (p < 0.001) in the session the following week. B, One month apart. values of the orientation-specific signals were 0.07% in the first session and 0.10% in the session of the following month. Run-by-run reproducibility was 0.64 and 0.62, respectively (p < 0.001). Left panels, Two anatomic images were coregistered manually based on intracortical veins indicated by blue rectangles. Right panels, 0° iso-orientation maps of BOLD fMRI obtained in the first (top) and second (bottom) sessions. Red plus signs indicating the activation sites of 0° orientation in the first session are overlaid on iso-orientation maps in the second session. Black-dotted contours roughly indicate common active areas between different imaging sessions.
Figure 6.
Figure 6.
Comparison of vascular artifacts in GE and SE BOLD fMRI maps. Data were obtained from the same cat shown in Figure 5 A. A, A 1-mm-thick anatomic image. B, Single-condition map obtained from GE BOLD data with one 20 s single-orientation stimulation before the initiation of continuous stimulation. Large surface veins in the anatomic image and with high GE BOLD changes marked by white arrowheads are overlaid on all images. C, D, Normalized magnitude maps of orientation-specific GE and SE BOLD signals obtained from continuous stimulation data. The of orientation-specific signals for GE BOLD and SE BOLD (within black dashed contours in A) are 0.20 and 0.12%, respectively. The same scale in A is used for B–D. E, Magnified normalized magnitude maps of orientation-specific GE and SE BOLD signals in the internal cortical region excluding large pial vessels (magenta rectangles in C and D). F, Pixel-wise comparison of normalized orientation-specific GE and SE BOLD magnitude maps shown in E.
Figure 7.
Figure 7.
Comparisons of iso-orientation maps of GE BOLD, CBV, and SE BOLD fMRI. Data were obtained from the same cat shown in Figures 5 A and 6. A, Iso-orientation maps of 0° stimulation with GE BOLD, CBV, and SE BOLD fMRI (from left to right). Bright pixels indicate BOLD or CBV increase during 0° stimulation. Red plus signs indicating the increase of CBV response for 0° stimulation are overlaid on the GE and SE BOLD orientation maps. The of orientation-specific signals for GE BOLD, CBV, and SE BOLD are 0.19, 0.66, and 0.13% in ROIs (black dashed contours in CBV map), respectively. Large vein areas (see Fig. 6 B) are shown with white arrowheads. B, Enlarged iso-orientation maps of the right hemisphere including the black dashed ROI. To assist comparisons, red plus signs indicating an increase in CBV for 0° stimulation are overlaid on the GE and SE BOLD 0° iso-orientation maps. C, Pixel-wise comparison of normalized 0° iso-orientation maps obtained from three different fMRI methods: GE BOLD versus CBV (blue dots), SE BOLD versus CBV (red dots), and GE versus SE BOLD fMRI (green dots). All correlation coefficients of the comparisons were highly significant (r = 0.83, 0.86, and 0.82; p < 0.001 for each, respectively).
Figure 8.
Figure 8.
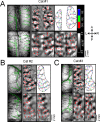
Comparison of OIS, GE BOLD, and SE BOLD iso-orientation maps. Data in A were obtained from the same cat shown in Figures 5 A, 6, and 7. Data in B were obtained from the same cat shown in Figure 5 B. A–C, Left, Cortical surface vessel images of a 570 nm optical image (top) and 1-mm-thick MR images reconstructed from 3-D venogram data (bottom). After the coregistration of two different modality images (see Materials and Methods), the large vessels tracking with green dotted lines in an OIS image were overlaid on an MR anatomic image. Right, 0° iso-orientation maps of OIS, GE BOLD fMRI, and SE BOLD fMRI and traces of local maxima of each orientation map (counter-clockwise from top left). Note that all of the values of the OIS map are inverted for direct comparison with BOLD maps. The of orientation-specific signals for OIS, GE BOLD, and SE BOLD are 0.25, 0.20, and 0.12% in A, 0.32, 0.10, and 0.09% in B, and 0.20, 0.09, and 0.08% in C, respectively. Average least distances for OIS versus GE BOLD and OIS versus SE BOLD are 0.23 and 0.23 mm in A, 0.22 and 0.23 mm in B, and 0.20 and 0.21 mm in C, respectively. Red plus signs indicating an increase in light absorption for 0° stimulation based on the OIS iso-orientation map are overlaid on fMRI maps. Black dashed contours indicating the OIS activation area are overlaid on all panels.
Figure 9.
Figure 9.
Hypothetical time courses of dHb-weighted optical imaging and BOLD signals. A, Observation based on dHb-weighted optical imaging of intrinsic signals. The optical imaging studies revealed that nonpreferred stimulation induced a larger hyperoxygenation (consequently decrease in dHb amount) compared with preferred stimulation. Thus, it expects that preferred stimulation induces a less positive BOLD signal than nonpreferred stimulation. B, Finding from BOLD fMRI studies. Preferred stimulation induced a larger hyperoxygenation compared with nonpreferred stimulation. Note that although the presence of BOLD dip is controversial, the polarity of the early dip, if exists, is consistent between A and B. a.u., Arbitrary units.

Similar articles

Cited by

References

    1. Blasdel GG. Differential imaging of ocular dominance and orientation selectivity in monkey striate cortex. J Neurosci. 1992;12:3115–3138. - PMC - PubMed
    1. Blasdel GG, Salama G. Voltage-sensitive dyes reveal a modular organization in monkey striate cortex. Nature. 1986;321:579–585. - PubMed
    1. Bosking WH, Crowley JC, Fitzpatrick D. Spatial coding of position and orientation in primary visual cortex. Nat Neurosci. 2002;5:874–882. - PubMed
    1. Boynton GM, Engel SA, Glover GH, Heeger DJ. Linear systems analysis of functional magnetic resonance imaging in human V1. J Neurosci. 1996;16:4207–4221. - PMC - PubMed
    1. Cheng K, Waggoner RA, Tanaka K. Human ocular dominance columns as revealed by high-field functional magnetic resonance imaging. Neuron. 2001;32:359–374. - PubMed

Publication types

MeSH terms