. 2007 Jun 27;27(26):7054-69.
doi: 10.1523/JNEUROSCI.1744-07.2007.

State-dependent modulation of amygdala inputs by dopamine-induced enhancement of sodium currents in layer V entorhinal cortex

Affiliations

State-dependent modulation of amygdala inputs by dopamine-induced enhancement of sodium currents in layer V entorhinal cortex

J Amiel Rosenkranz et al. J Neurosci. .

Abstract

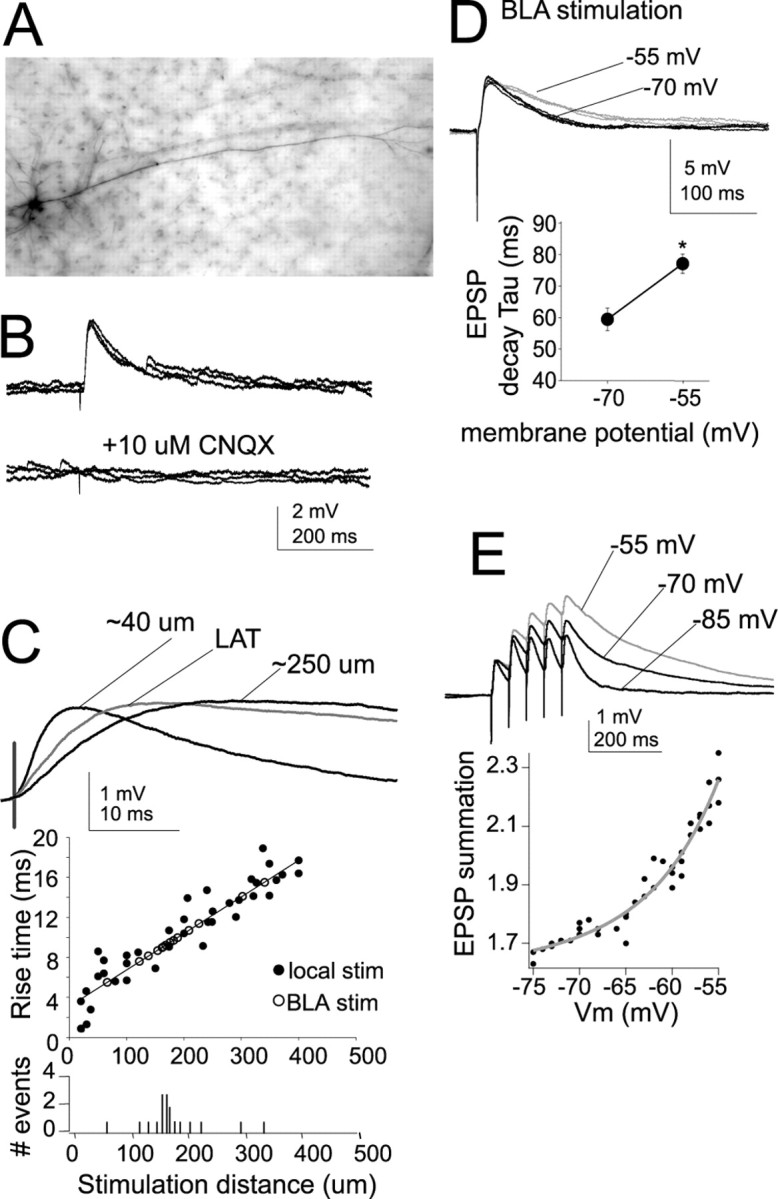
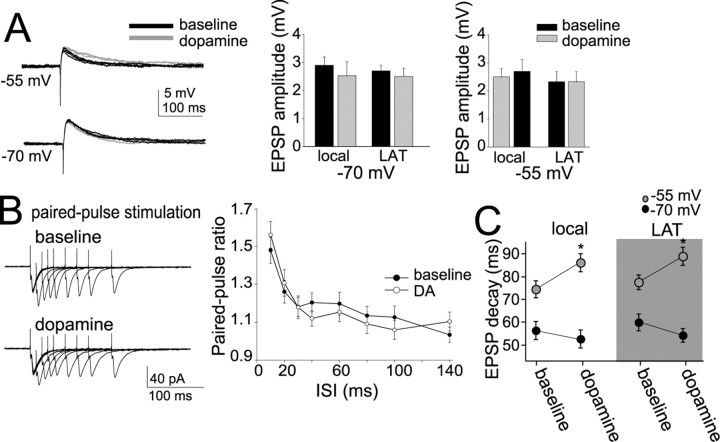
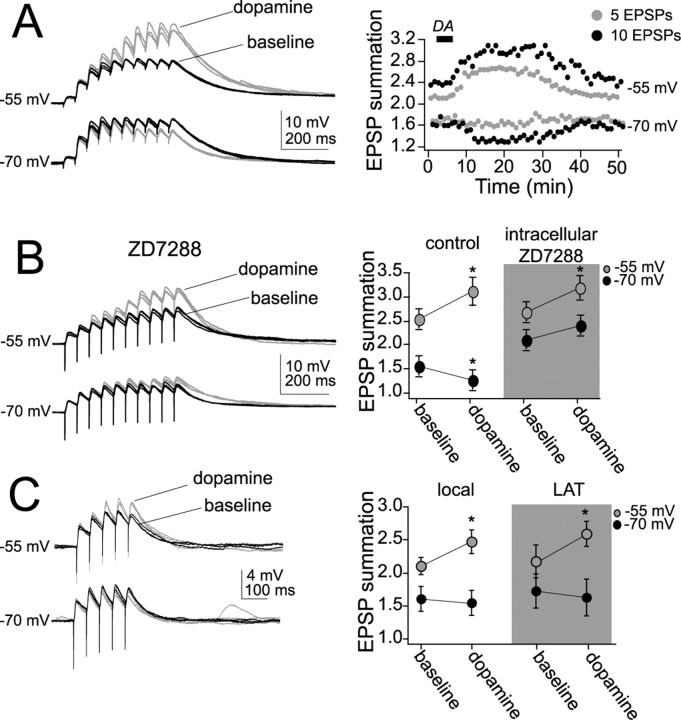
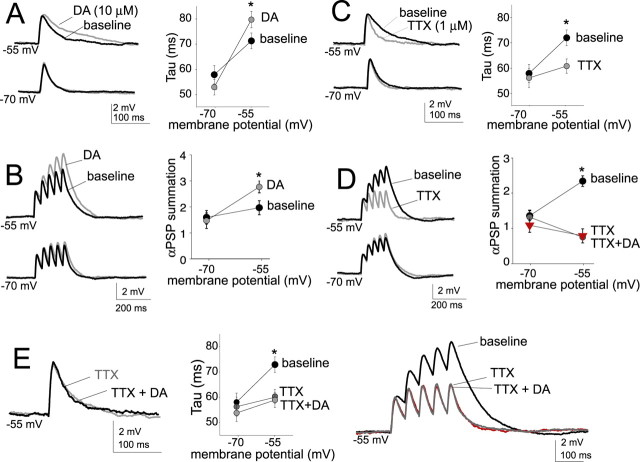
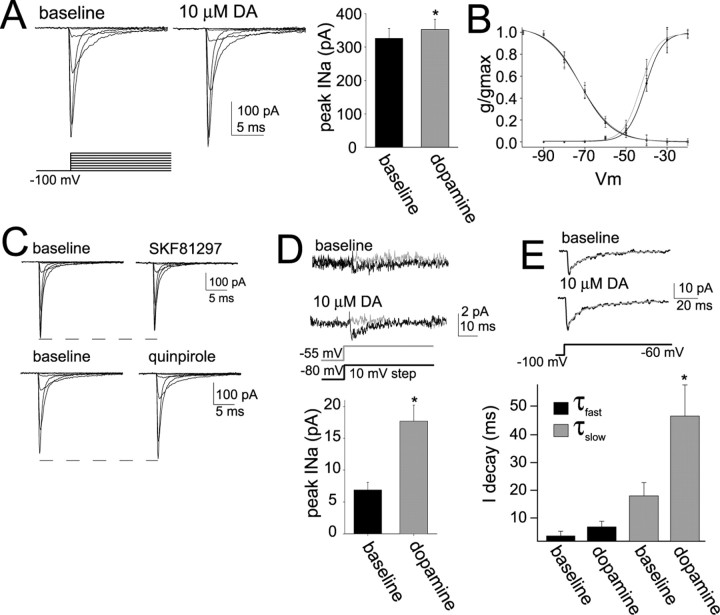
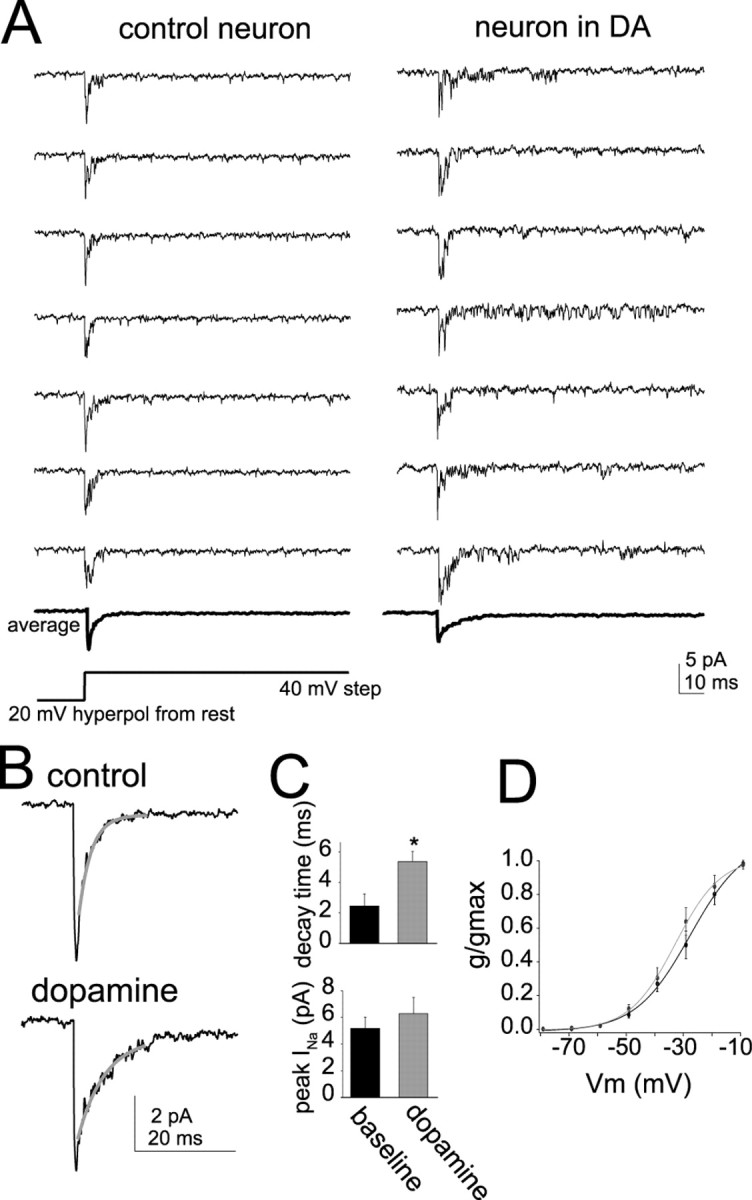
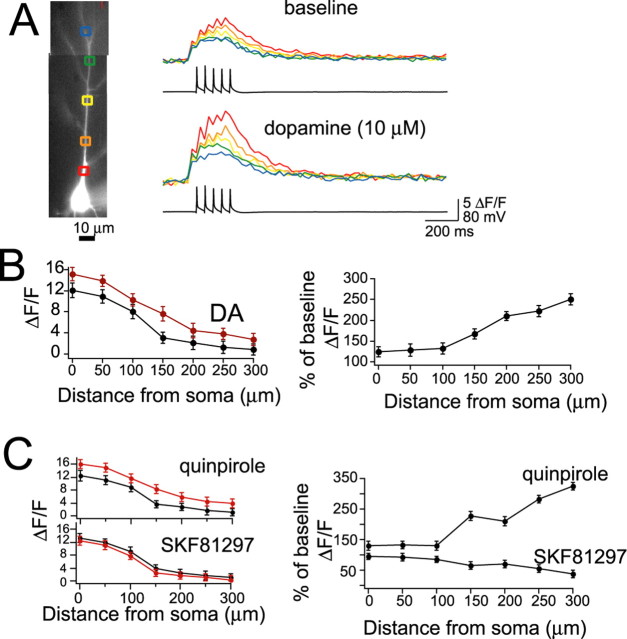
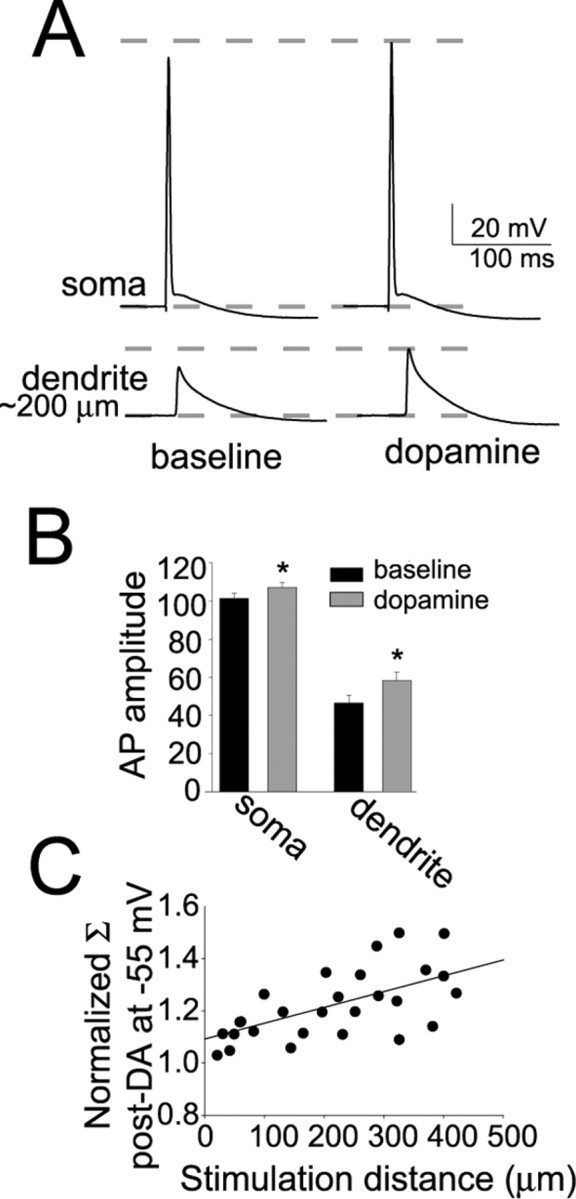
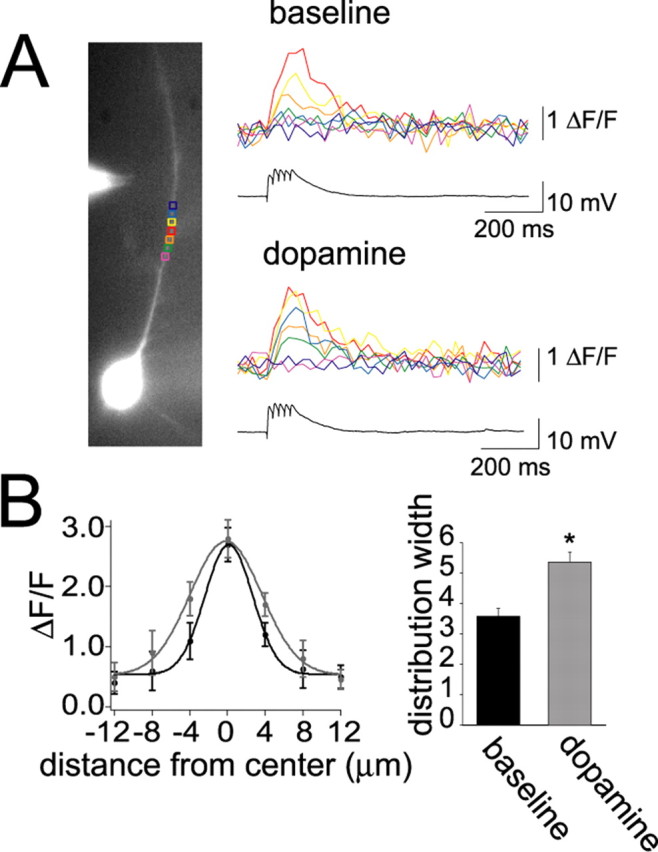
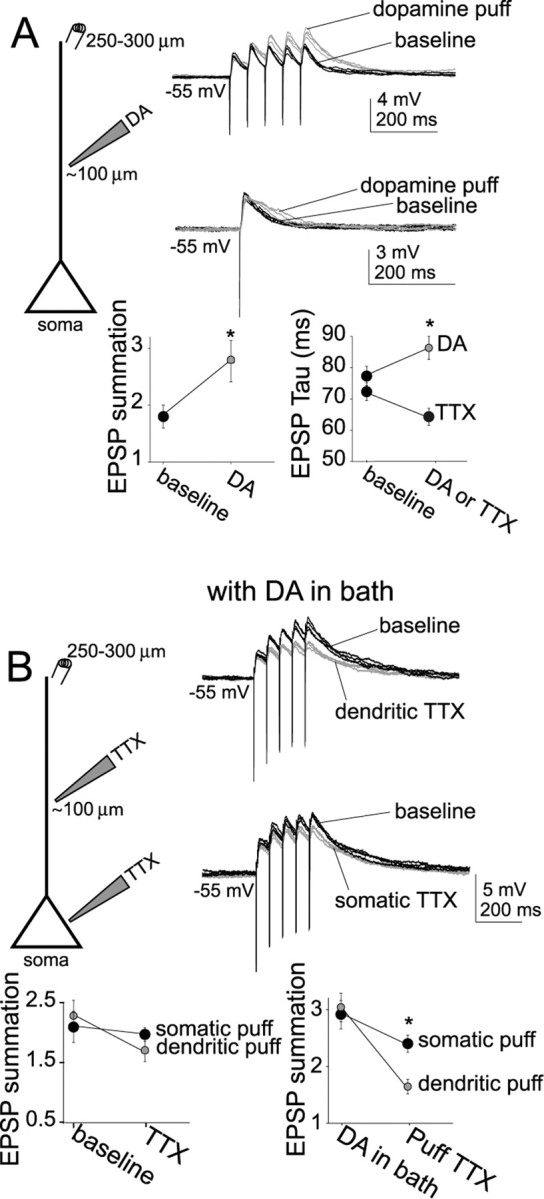
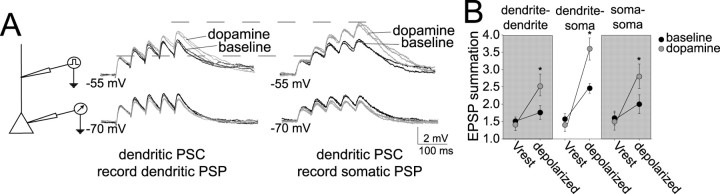
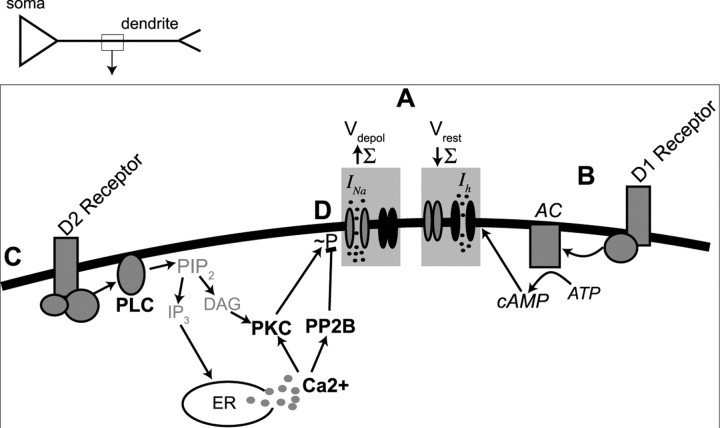
Interaction between the entorhinal cortex (EC) and basolateral amygdala (BLA) may be a fundamental component in the consolidation of many forms of affective memory, such as inhibitory avoidance. Dopamine (DA) in the EC is necessary for, and may facilitate, this form of learning. This effect of DA on affective behaviors may be accomplished in part through modulation of amygdala inputs. Although it is known that DA can modulate neuronal activity in the EC, it is not known whether DA modulates inputs from the BLA. In this study, we used in vitro patch-clamp recordings and Ca2+ imaging of layer V neurons in the rat lateral EC to determine whether DA modulates the integration of inputs from the BLA and the mechanism for this modulation. We found that DA exerted actions that depended on the neuronal state. Near resting membrane potentials, DA suppressed integration of inputs, whereas at depolarized potentials, DA enhanced integration. DA enhanced the integration by a D2-mediated enhancement of Na+ currents, via phospholipase C. These experiments demonstrate that DA can exert actions in the EC that depend on the membrane voltage. This effect of DA may affect a wide range of inputs. Functionally, by enhancement of amygdala inputs that arrive in concert with other inputs, or during depolarized states, DA can facilitate the impact of affect on memory in a subset of conditions.


Figures

Figure 1.
Figure 1.
Characteristics of EPSPs. A, Example of a neurobiotin-filled layer V pyramidal neuron recorded in lateral EC. B, Stimulation of the LAT or local stimulation close to the apical dendrite of layer V EC neurons evokes an EPSP in the presence of blockers of NMDA, GABAA, and GABAB receptors. The remaining component of this EPSP is entirely blocked by 10 μm CNQX, an AMPA/kainate receptor blocker. For maximal clarity, in all panels, examples of LAT or local stimulation are shown, unless indicated otherwise. C, Traces show an EPSP evoked by stimulating electrodes ∼40 and 250 μm from the soma and an EPSP evoked by LAT stimulation (stim; average of 5 traces). The rise time of EPSPs is a rough index of the distance of a synapse from the recording electrode at the soma. The rise time of the locally evoked EPSPs is plotted as a function of distance of the stimulation electrode from the soma. By plotting the rise times of EPSPs evoked by LAT stimulation along the regression constructed from locally evoked EPSPs, one can derive a rough estimate of the distance of the LAT inputs from the soma. The histogram plots the number of LAT-evoked events as a function of their extrapolated input distance. The majority of LAT inputs display rise times that correspond to EPSPs evoked by local stimulation at 150–200 μm from the soma. D, The decay time of EPSPs was strongly voltage dependent, with a slower decay time constant observed at depolarized membrane potentials (gray). Three overlayed traces at each voltage are displayed. E, A consequence of this slower decay time was increased summation of EPSPs at depolarized membrane potentials (traces displayed are averages of 5 sweeps). Membrane potentials of −70 and −55 mV were chosen for statistical comparison. *p < 0.05, significant difference in a paired t test comparison between the two membrane potentials.
Figure 2.
Figure 2.
DA has minimal effects on EPSP amplitude. A, Application of DA (10 μm for 2–3 min) did not have a significant effect on the amplitude of a single LAT- or local-evoked EPSP, regardless of the membrane potential. Five traces in baseline and five after DA are overlayed and displayed for each panel. Black traces are baseline, and gray traces are after DA. B, Paired-pulse facilitation of EPSCs did not change after application of DA, examined over a range of frequencies. Displayed are overlays of averaged traces of paired stimulations at varying intervals. C, Application of DA resulted in a slower decay time of EPSPs (see A). This was observed specifically at depolarized membrane potentials. *p < 0.05, significant difference compared with baseline conditions (paired t test).
Figure 3.
Figure 3.
DA modulates integration of EPSPs. A, Overlayed traces of a train of 10 EPSPs demonstrate that DA (gray traces) enhances summation at a depolarized membrane potential but decreases summation near the resting membrane potential. The right panel plots the time course of the effects of DA in two neurons (black circles are summation of 10 EPSPs; gray circles are summation of 5 EPSPs). The time course of the effects of DA in this example indicate that it began shortly after application of DA (at solid bar) and returned close to baseline. B, As demonstrated previously, the effects of DA on summation near Vrest are blocked by ZD7288 but not the effects of DA at a depolarized membrane potential. C, DAergic modulation of the summation of five EPSPs also displayed a voltage dependence and allows more isolated examination of processes involved in DAergic enhancement of integration at depolarized membrane potentials because effects on summation of EPSPs near Vrest are minimal. *p < 0.05, significant difference in a paired t test comparison between baseline and post-DA conditions.
Figure 4.
Figure 4.
DAergic modulation of postsynaptic PSPs is blocked by TTX. All synaptic inputs were blocked, and an EPSC-shaped current was injected. The resulting αPSP displayed similarities to EPSPs. A, There was a slower αPSP decay time at depolarized membrane potentials. DA (gray) caused an additional prolongation of the αPSP decay. B, Also similar to EPSPs, there was greater αPSP summation at depolarized membrane potentials, and DA further enhanced summation at depolarized membrane potentials. C, D, Bath application of TTX (1 μm; gray) blocked the prolongation of the EPSP decay that is observed at depolarized membrane potentials in baseline conditions (C) and blocked the enhanced summation of αPSP observed at depolarized membrane potentials in baseline conditions (D). E, Preapplication of TTX blocked the effect of DA on EPSP decay time and summation at depolarized membrane potentials. All αPSP traces are averages of five sweeps. *p < 0.05, significant difference in a paired t test comparison between baseline and drug conditions.
Figure 5.
Figure 5.
DA modulates Na+ current measured from nucleated patches. A, Application of DA caused a small increase in the peak INa. B, DA (gray) caused a leftward shift in the voltage of activation of INa, without a significant change in the inactivation. C, The effects of DA were mimicked by a D2 agonist quinpirole (10 μm). A D1 agonist, SKF81297 (10 μm), exerted the opposite effect, decreasing Na+ currents. D, To test whether INa was modulated within the limited voltage ranges examined in current-clamp recordings (above), INa was evoked with a 10 mV step to −55 mV, grossly mimicking the depolarization evoked by summation of EPSPs at depolarized membrane potentials. The peak amplitude of this INa was greatly enhanced by DA. Overlayed are averaged traces of the current evoked by a 10 mV step to −55 mV (black) and to −80 mV (gray) for comparison. E, DA also prolonged the decay time of a Na+ current evoked by a voltage step from −100 mV to approximately −60 mV. All INa traces depicted are averages of 5–10 sweeps. *p < 0.05, significant difference in a paired t test comparison between baseline and DA conditions.
Figure 6.
Figure 6.
DA increases the activity of Na+ channels. A, Cell-attached recordings of multiple Na+ channels activated by a 40 mV step from 20 mV hyperpolarized to rest. Neurons exposed to DA (right) displayed a greater tendency for longer-lasting channel activity than nonexposed control neurons (left). B, The decay time of the averaged Na+ current was fit with a single exponential (gray). Neurons that were exposed to DA (bottom) displayed averaged current that decayed slower compared with control neurons. C, The decay time of the current was prolonged in neurons exposed to DA, and there was a trend toward increased average peak amplitude. The asterisk indicates a significant difference in a t test of control neurons compared with a separate group of neurons exposed to DA. D, Similar to nucleated patch recordings of INa, there was a shift in the activation of Na+ channels in neurons exposed to DA (gray).
Figure 7.
Figure 7.
DA increases backpropagation of signals into dendrites. A, Calcium imaging of the backpropagation of APs was used as an initial index of dendritic signal propagation. DA enhanced this signal along the apical dendrite. Line trace color corresponds to the color of the box at a location on the dendrite. B, DA increased the amplitude of the signal along the entire extent of the apical dendrite examined. The effectiveness of DA on dendritic signals (percentage change) was greater at dendritic sites further from the soma (right). C, Similar to the effects of DA on EPSPs summation and INa, the effects of DA on the dendritic signal was mimicked by the DA D2 agonist quinpirole (10 μm), whereas the opposite effect was seen after application of the DA D1 agonist SKF81297 (10 μm).
Figure 8.
Figure 8.
DA increases the amplitude of antidromic bAPs. A, The amplitude of bAPs recorded in the dendrite 150–300 μm from the soma was increased by DA (right; in this example the bAP was recorded ∼200 μm from the soma). Top traces are recordings from the soma, and bottom traces are recordings from the apical dendrite. B, Plots of group data indicate that a significant increase in the amplitude of antidromic APs was observed in the soma and dendrites after DA. Similar to the calcium signal, the percentage change of the dendritic AP was greater than the change in the somatic AP. *p < 0.05, significant difference with a paired t test comparison between baseline and DA conditions. C, Inputs of varying distances from the soma were activated by varying the distance of the stimulation electrode from the soma, along the apical dendrite. Summation of five EPSPs after DA was normalized to baseline summation (see Results). DA had a greater impact on summation of EPSPs that were evoked more distally. Σ indicates summation.
Figure 9.
Figure 9.
DA enhances orthograde propagation of dendritic signals. A, In some neurons, a synaptically evoked calcium signal was observed in a discrete region. Application of DA increased the signal along some parts of this region (e.g., compare green or blue traces between baseline and DA conditions). B, To quantify the spread of this signal, the location of the peak signal was found, and the signal was measured at this dendritic site and at regions on either side of this site, in increments of 4 μm regions of interest. The spread of the signal can be plotted as the change in fluorescence as a function of distance from the site of the peak signal. From this plot, it can be seen that DA (gray) does not significantly increase the peak signal but increases the amplitude of the signal on either side of the peak, indicative of increased spread of EPSP-evoked depolarization. This can be quantified as a significant increase in the width of the distribution. *p < 0.05, significant difference with a paired t test comparison between baseline and DA conditions.
Figure 10.
Figure 10.
Direct puff application of DA to dendrites is sufficient to mimic the actions of DA. A, Puff application of DA (gray traces) to the dendrite was sufficient to mimic the effects of bath application of DA on EPSP summation (top) and decay time (bottom). B, At a depolarized membrane potential (−55 mV), with DA (10 μm) in the bath, dendritic TTX puff application (top traces) was more effective in reversing the actions of DA on EPSP summation than somatic puff (bottom traces). However, in baseline conditions without DA, dendritic puff application of TTX exerted only a slightly greater effect on EPSP summation than somatic puff application in baseline conditions (left plot). Puffing pipettes were placed ∼100 μm from the soma, whereas stimulating electrodes were placed 250–300 μm from the soma. Black traces represent baseline conditions, and gray traces are after puff application. *p < 0.05, significant difference with a paired t test between baseline conditions and after puff application of drug.
Figure 11.
Figure 11.
DA has a greater impact on integration of signals that propagate down the dendrite compared with local signals. A, Dual recordings of the dendrite and soma of neurons were performed to examine propagation of αPSPs from the dendrite to the soma. αPSPs injected into the dendrite and recorded in the dendrite display similar features as αPSPs injected to the soma and recorded in the soma (see Fig. 3): the summation at depolarized membrane potentials is greater, and DA enhanced summation at depolarized membrane potentials. However, when examining αPSPs initiated in the dendrite while recording at the soma, the effect of DA on summation is significantly greater. B, The effect of DA on αPSPs that travel to the soma from the dendrite is much greater, indicating that DA facilitates signals that must travel down the dendrite. This figure depicts recordings at the soma and the apical dendrite, ∼200 μm from the soma. Black traces represent baseline conditions, and gray traces represent DA conditions. *p < 0.05, significant difference in a paired t test comparison between baseline and DA conditions.
Figure 12.
Figure 12.
Summary of the effects of DA on synaptic integration. A, DA exerts two primary actions on summation of PSPs: (1) increase in summation (Σ) at depolarized membrane potentials (Vdepol) by enhancement of Na currents, and (2) reduction in summation near Vrest by enhancement of h-currents. B, Activation of DA D1 receptors reduced summation near Vrest by a pathway dependent on adenylyl cyclase and cAMP (Rosenkranz and Johnston, 2006). C, Activation of DA D2 receptors increased summation by a pathway dependent on PLC, internal Ca2+, and PP2B. Blockade of PKC exerted an opposing influence, consistent with a D2-mediated enhancement of summation through reduction in Na-channel phosphorylation (∼P), which increases Na-channel activity. This, however, does not rule out other ion channels or signaling molecules in the actions of DA. Our data indicate that these are the most prominent signaling cascades and ion channels involved in the DAergic actions under these conditions. In addition, although our data are consistent with D2-mediated modulation of dendritic excitability, it is possible that this does not occur via modulation of Na+ channels and does not rule out potential involvement of D1 receptors. Signaling molecules in bold lettering indicate evidence from the current study. Signaling molecules in italics represent evidence from a previous study (Rosenkranz and Johnston, 2006). Gray lettering indicates signaling molecules that are known to usually be in that signaling cascade but that were not examined in this study. AC, Adenylyl cyclase; PIP2, phosphatidylinositol 4,5-bisphosphate; IP3, inositol 1,4,5-trisphosphate; DAG, diacylglycerol; ER, endoplasmic reticulum.

Similar articles

Cited by

References

    1. Agrawal N, Hamam BN, Magistretti J, Alonso A, Ragsdale DS. Persistent sodium channel activity mediates subthreshold membrane potential oscillations and low-threshold spikes in rat entorhinal cortex layer V neurons. Neuroscience. 2001;102:53–64. - PubMed
    1. Aizman O, Brismar H, Uhlen P, Zettergren E, Levey AI, Forssberg H, Greengard P, Aperia A. Anatomical and physiological evidence for D1 and D2 dopamine receptor colocalization in neostriatal neurons. Nat Neurosci. 2000;3:226–230. - PubMed
    1. Akil M, Edgar CL, Pierri JN, Casali S, Lewis DA. Decreased density of tyrosine hydroxylase-immunoreactive axons in the entorhinal cortex of schizophrenic subjects. Biol Psychiatry. 2000;47:361–370. - PubMed
    1. Arnold SE, Hyman BT, Van Hoesen GW, Damasio AR. Some cytoarchitectural abnormalities of the entorhinal cortex in schizophrenia. Arch Gen Psychiatry. 1991;48:625–632. - PubMed
    1. Astman N, Gutnick MJ, Fleidervish IA. Activation of protein kinase C increases neuronal excitability by regulating persistent Na+ current in mouse neocortical slices. J Neurophysiol. 1998;80:1547–1551. - PubMed

Publication types

MeSH terms