. 2007 Sep;18(9):3486-501.
doi: 10.1091/mbc.e07-02-0190. Epub 2007 Jun 27.

The trans-Golgi network accessory protein p56 promotes long-range movement of GGA/clathrin-containing transport carriers and lysosomal enzyme sorting

Affiliations

The trans-Golgi network accessory protein p56 promotes long-range movement of GGA/clathrin-containing transport carriers and lysosomal enzyme sorting

Gonzalo A Mardones et al. Mol Biol Cell. 2007 Sep.

Abstract

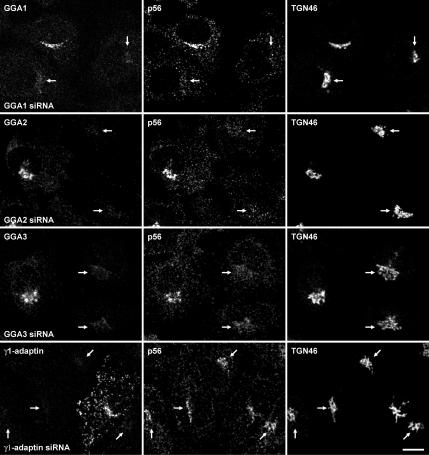
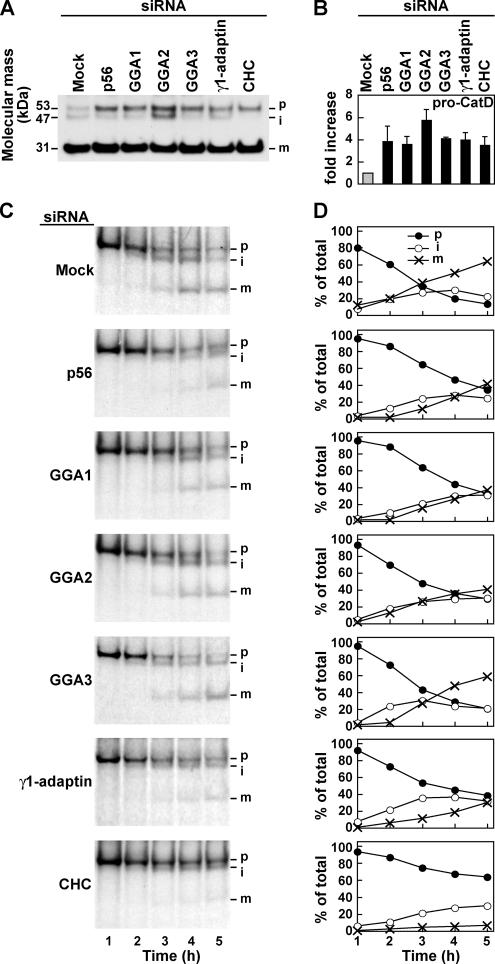
The sorting of acid hydrolase precursors at the trans-Golgi network (TGN) is mediated by binding to mannose 6-phosphate receptors (MPRs) and subsequent capture of the hydrolase-MPR complexes into clathrin-coated vesicles or transport carriers (TCs) destined for delivery to endosomes. This capture depends on the function of three monomeric clathrin adaptors named GGAs. The GGAs comprise a C-terminal "ear" domain that binds a specific set of accessory proteins. Herein we show that one of these accessory proteins, p56, colocalizes and physically interacts with the three GGAs at the TGN. Moreover, overexpression of the GGAs enhances the association of p56 with the TGN, and RNA interference (RNAi)-mediated depletion of the GGAs decreases the TGN association and total levels of p56. RNAi-mediated depletion of p56 or the GGAs causes various degrees of missorting of the precursor of the acid hydrolase, cathepsin D. In the case of p56 depletion, this missorting correlates with decreased mobility of GGA-containing TCs. Transfection with an RNAi-resistant p56 construct, but not with a p56 construct lacking the GGA-ear-interacting motif, restores the mobility of the TCs. We conclude that p56 tightly cooperates with the GGAs in the sorting of cathepsin D to lysosomes, probably by enabling the movement of GGA-containing TCs.


Figures

Figure 1.
Figure 1.
Expression of GGAs and p56 in different cell lines. (A) Detection of endogenous GGA1, GGA2, GGA3, and p56 in HeLa cells by immunoblot analysis using specific mouse monoclonal antibodies to each GGA and a rabbit polyclonal antibody to p56. The positions of molecular mass markers are indicated on the left. (B) Immunoblot analysis of the expression of the proteins indicated on the right in the different cell lines indicated on top.
Figure 2.
Figure 2.
Comparison of the intracellular localization of endogenous GGAs and AP1 by confocal immunofluorescence microscopy. Human fibroblasts grown on coverslips were fixed, permeabilized, and triple-labeled with rabbit polyclonal antibody to GGA1 (A–C), mouse monoclonal antibodies to GGA2 (A), GGA3 (B), or the γ1-adaptin subunit of AP1 (C), and sheep antibody to TGN46 (A–C), followed by Alexa-488–conjugated donkey anti-rabbit IgG (green channel), Alexa-594–conjugated donkey anti-mouse IgG (red channel), and Alexa-647–conjugated donkey anti-sheep IgG (blue channel). Nuclei were stained with Hoechst 33342 dye (gray channel). Stained cells were examined by confocal fluorescence microscopy. Merging of the images in the green, red, and gray channels generated the first picture in the second row; yellow indicates overlapping localization of the green and red channels. The second picture in the second row was generated by merging of the images in the green, red, blue, and gray channels; yellow indicates overlapping localization of the green and red channels, cyan indicates overlapping localization of the green and blue channels, magenta indicates overlapping localization of the red and blue channels, and white indicates overlapping localization of the red, green, and blue channels. The third panel in the second row is a composite of threefold magnified views of the Golgi region marked with a dashed box in the indicated channels. Bars, 10 μm.
Figure 3.
Figure 3.
Comparison of the intracellular localization of endogenous p56, GGA3, AP1, and clathrin analyzed by confocal immunofluores-cence microscopy. Human fibroblasts grown on coverslips were fixed, permeabilized, and triple-labeled with rabbit polyclonal antibody to p56 (A–C), mouse monoclonal antibodies to GGA3 (A), the γ1-adaptin subunit of AP1 (B), or clathrin heavy chain (C), and sheep antibody to TGN46 (A–C), followed by Alexa-488–conjugated donkey anti-rabbit IgG (green channel), Alexa-594–conjugated donkey anti-mouse IgG (red channel), and Alexa-647–conjugated donkey anti-sheep IgG (blue channel). Nuclei were stained with Hoechst 33342 dye (gray channel). Stained cells were examined by confocal fluorescence microscopy. Merging of the images in the green, red, and gray channels generated the first picture in the second row; yellow indicates overlapping localization of the green and red channels. Merging of the images in the green, red, blue, and gray channels generated the second picture in the second row; yellow indicates overlapping localization of the green and red channels, cyan indicates overlapping localization of the green and blue channels, magenta indicates overlapping localization of the red and blue channels, and white indicates overlapping localization of the red, green, and blue channels. The third panel in the second row is a composite of threefold magnified views of the Golgi region marked with a dashed box in the indicated channels. Arrows in C point to foci of colocalization. Bars, 10 μm.
Figure 4.
Figure 4.
Interactions of p56 and GGAs demonstrated by FRET analysis and corecruitment to the TGN. (A) Live NRK cells expressing the indicated CFP- (red channel) and YFP-fusion (green channel) proteins were imaged at 37°C by confocal fluorescence microscopy. FRET signals were acquired immediately after recording of the signals in the red and green channels. Merging red and green channels generated the third picture in each row. The fourth picture in each row represents a FRET-corrected image displayed in pseudocolor mode, with red and blue areas corresponding to high and low FRET values, respectively. (B) NRK cells transfected with Myc-tagged GGA1 were fixed, permeabilized, and double-labeled with rabbit polyclonal antibody to p56 and mouse mAb to the Myc epitope, followed by Alexa-594–conjugated donkey anti-rabbit IgG (red channel) and Alexa-488–conjugated donkey anti-mouse IgG (green channel). Nuclei were stained with Hoechst 33342 dye (blue channel). Stained cells were examined by confocal fluorescence microscopy. Merging red, green, and blue channels generated the third picture; yellow indicates overlapping localization of the green and red signals. Bars, 10 μm.
Figure 5.
Figure 5.
Biogenetic relationships of the GGAs and p56 examined by RNAi-mediated depletion. HeLa cells were transfected twice with siRNAs directed to GAPDH (Mock), p56, GGA1, GGA2, GGA3, GGA1 plus GGA2 (GGA1 + 2), GGA1 plus GGA3 (GGA1 + 3), the γ1-adaptin subunit of AP1, or CHC. After the second round of transfection, equivalent amounts of homogenates of siRNA-treated cells were subjected to SDS-PAGE and immunoblotting using antibodies to the proteins indicated on the right.
Figure 6.
Figure 6.
Effects of the depletion of individual GGAs on the intracellular localization of the remaining GGAs. The effects of depletion of GGA1 (first row), GGA2 (second row), or GGA3 (third row) on the expression and distribution of the remaining GGAs in HeLa cells were assessed by indirect immunofluorescence microscopy. Mixed mock- and siRNA-treated cells grown on coverslips were fixed, permeabilized, and triple-labeled with rabbit polyclonal antibody to GGA1, sheep polyclonal antibody to GGA2, and mouse mAb to GGA3, followed by Alexa-594–conjugated donkey anti-rabbit IgG (red channel), Alexa-488–conjugated donkey anti-sheep IgG (green channel), and Alexa-647–conjugated donkey anti-mouse IgG (blue channel). Stained cells were examined by confocal fluorescence microscopy. Bar, 10 μm.
Figure 7.
Figure 7.
Effect of the depletion of GGAs on the intracellular localization of p56. HeLa cells were transfected twice with siRNAs directed to GAPDH (Mock), GGA1, GGA2, GGA3, or the γ1-adaptin subunit of AP1, as indicated in the figure. After the second round of transfection, the effects of the RNAi depletion on the distribution of p56 in cells were assessed by confocal immunofluorescence microscopy. Mixed mock- and siRNA-treated cells grown on coverslips were fixed, permeabilized, and triple-labeled with mouse monoclonal antibodies to GGA1 (first row), GGA2 (second row), GGA3 (third row), or the γ1-adaptin subunit of AP1 (fourth row), rabbit polyclonal antibody to p56, and sheep polyclonal antibody to TGN46, followed by Alexa-594–conjugated donkey anti-mouse IgG (red channel), Alexa-488–conjugated donkey anti-rabbit IgG (green channel), and Alexa-647–conjugated donkey anti-sheep IgG (blue channel). Stained cells were examined by confocal fluorescence microscopy. Arrows indicate the position of the Golgi complex in siRNA-depleted cells. Bar, 10 μm.
Figure 8.
Figure 8.
Effect of moderate overexpression of Myc-GGA3 on p56 levels in cells depleted of GGA2. (A) HeLa cells were transfected twice with siRNAs directed to GAPDH (Mock), or GGA2. After the second round of siRNA treatment, GGA2-depleted cells were transfected with Myc-GGA3, and after 16 h, the effects of Myc-GGA3 on the distribution of p56 in cells were assessed by indirect immunofluorescence. Mixed mock- and GGA2-depleted cells grown on coverslips were fixed, permeabilized, and triple-labeled with sheep antibody to GGA2, mouse antibody to the Myc epitope, and rabbit antibody to p56, followed by Alexa-594–conjugated donkey anti-sheep IgG (red channel), Alexa-488–conjugated donkey anti-mouse IgG (green channel), and Alexa-647–conjugated donkey anti-rabbit IgG (blue channel). Solid arrowheads indicate the position of the Golgi complex in a mock-depleted, untransfected cell. Open arrowheads indicate the position of the Golgi complex in a GGA2-depleted, untransfected cell. Arrows indicate the position of the Golgi complex in a GGA2-depleted, Myc-GGA3–expressing cell. Bar, 10 μm. (B) Equivalent amounts of HeLa cells transfected with siRNAs and Myc-GGA3 as indicated in A, were subjected to SDS-PAGE and immunoblotting using antibodies to GGA2, the Myc epitope, p56, or actin (loading control).
Figure 9.
Figure 9.
Immunoblot and pulse-chase analysis of the maturation of cathepsin D in cells depleted of GGAs or p56. (A) HeLa cells were transfected twice with siRNAs directed to GAPDH (Mock), p56, GGA1, GGA2, GGA3, the γ1-adaptin subunit of AP1, or CHC. After the second round of transfection, equivalent amounts of homogenates of siRNA-treated cells were subjected to SDS-PAGE and immunoblotting using antibody to cathepsin D. The positions and molecular masses (in kDa) of marker proteins are indicated on the left. (B) The densities of the immunoblot signals for the precursor form of cathepsin D from A were determined, and the fold increase for each RNAi treatment was calculated. Bars represent the mean ± SD from three independent experiments. (C) HeLa cells were transfected twice with siRNAs directed to GAPDH (Mock), p56, GGA1, GGA2, GGA3, the γ1-adaptin subunit of AP1 or CHC. After the second round of transfection, cells were metabolically labeled for 2 h at 20°C with [35S]methionine-cysteine and chased for different periods at 37°C. Cells were solubilized, and the extracts were subjected to immunoprecipitation of cathepsin D. The immunoprecipitates were analyzed by SDS-PAGE and fluorography. (A and C) The positions of the precursor (p), intermediate (i), and mature heavy chain (m) forms of cathepsin D are indicated on the right. (D) The autoradiographic density of each cathepsin D species from C was determined, and the percentage of each form at each chase time was calculated after normalization for the number of methionine and cysteine residues.
Figure 10.
Figure 10.
Decreased mobility of YFP-GGA1–containing carriers in cells depleted of p56. (A) HeLa (top row) and H4 cells (bottom row) were transfected twice with siRNAs directed to GAPDH (Mock), or p56. After the second round of transfection, the effects of the RNAi depletion on the distribution of GGA1 in cells were assessed by indirect immunofluorescence. Mixed mock- and p56-depleted cells grown on coverslips were fixed, permeabilized, and triple-labeled with rabbit antibody to p56, mouse antibody to GGA1, and sheep antibody to TGN46, followed by Alexa-488—conjugated donkey anti-rabbit IgG, Alexa-594—conjugated donkey anti-mouse IgG, and Alexa-647—conjugated donkey anti-sheep IgG. Stained cells were examined by confocal fluorescence microscopy. Arrows indicate the position of the Golgi complex in p56-depleted cells. (B) H4 cells were transfected twice with siRNAs directed to GAPDH (Mock) or either of two siRNAs directed to the coding sequence or the 5′ untranslated region of p56 (p56 and p56-5′). After the second round of transfection, equivalent amounts of siRNA-treated cells were subjected to SDS-PAGE and immunoblotting using antibodies to p56, GGA1, or actin (loading control). (C—F) H4 cells were transfected with siRNAs directed to GAPDH (Mock) or p56 as indicated in A and after the second round of siRNA treatment were transfected with YFP-GGA1. The effects of the RNAi on the mobility of vesicles containing YFP-GGA1 in cells were assessed by time-lapse microscopy. (C) Mock siRNA-treated cell showing a vesicle moving away from the TGN region (trajectory indicated by arrow) and another vesicle moving toward the TGN region (trajectory indicated by arrowhead). Time after the start of imaging (in seconds) is shown in the bottom left of each panel. (D) The first frame acquired for either a mock- or a p56-depleted cell is shown on the left. The pictures on the right were generated by merging images of the TGN region acquired over a ∼110-s period; the trajectories of mobile vesicles are shown as lines. The frequency of mobile vesicles (E) and the summation of the length of the trajectories (F) were quantified for mock- and p56-depleted cells. Bars represent the mean ± SD from three independent experiments. Bars, 10 μm (A and D), 2 μm (C).
Figure 11.
Figure 11.
Binding of p56 to GGAs is required for the mobility of YFP-GGA1-containing carriers. (A) NRK cells transfected either with Myc-tagged, full-length p56 (Myc-p56) or a Myc-tagged construct lacking the N-terminal, GGA-interacting segment of p56 (Myc-ΔN-p56; residues 125–441) were fixed, permeabilized, and double-labeled with mAb to the Myc epitope and rabbit polyclonal antibody to GGA1, followed by Alexa-594–conjugated donkey anti-mouse IgG (red channel) and Alexa-488–conjugated donkey anti-rabbit IgG (green channel). Nuclei were stained with Hoechst 33342 dye (blue channel). Stained cells were examined by confocal fluorescence microscopy. Merging red, green, and blue channels generated the third picture; yellow indicates overlapping localization of the green and red channels. (B) H4 cells were transfected twice with siRNA directed to GAPDH (Mock), or with siRNA directed to the 5′ untranslated region of p56 (p56-5′). After the second round of siRNA treatment, p56-depleted cells were transfected either with Myc-p56 or Myc-ΔN-p56, and after 16 h, equivalent amounts of cells were subjected to SDS-PAGE and immunoblotting using antibodies to p56 (raised against an N-terminal peptide), the Myc epitope, or actin (loading control). (C–E) H4 cells were transfected with the p56-5′ siRNA as indicated in B and after the second round of siRNA treatment were cotransfected with YFP-GGA1 and either with Myc-p56 or Myc-ΔN-p56. The effects of the expression of the Myc-epitope-tagged proteins on the mobility of vesicles containing YFP-GGA1 were assessed by time-lapse microscopy. (C) The TGN region of the first frame acquired for p56-depleted cells, expressing either Myc-p56 (top) or Myc-ΔN-p56 (bottom), was merged with the trajectories of mobile vesicles (red lines) acquired over a ∼110-s period. The frequency of mobile vesicles (D) and the summation of the length of the trajectories (E) were quantified for p56-depleted cells expressing either Myc-p56 or Myc-ΔN-p56. Bars represent the mean ± SD from three independent experiments. Bars, (A and C) 10 μm.

Similar articles

Cited by

References

    1. Ahle S., Ungewickell E. Auxilin, a newly identified clathrin-associated protein in coated vesicles from bovine brain. J. Cell Biol. 1990;111:19–29. - PMC - PubMed
    1. Boehm M., Bonifacino J. S. Adaptins: the final recount. Mol. Biol. Cell. 2001;12:2907–2920. - PMC - PubMed
    1. Bolte S., Cordelières F. P. A guided tour into subcellular colocalization analysis in light microscopy. J. Microsc. 2006;224:213–232. - PubMed
    1. Boman A. L., Zhang C. J., Zhu X., Kahn R. A. A family of ADP-ribosylation factor effectors that can alter membrane transport through the trans-Golgi. Mol. Biol. Cell. 2000;11:1241–1255. - PMC - PubMed
    1. Bonifacino J. S. The GGA proteins: adaptors on the move. Nat. Rev. Mol. Cell Biol. 2004;5:23–32. - PubMed

Publication types

MeSH terms

Substances