. 2007 Sep;18(9):3414-28.
doi: 10.1091/mbc.e07-01-0088. Epub 2007 Jun 27.

Multiple 40-kDa heat-shock protein chaperones function in Tom70-dependent mitochondrial import

Affiliations

Multiple 40-kDa heat-shock protein chaperones function in Tom70-dependent mitochondrial import

Melanie K Bhangoo et al. Mol Biol Cell. 2007 Sep.

Abstract

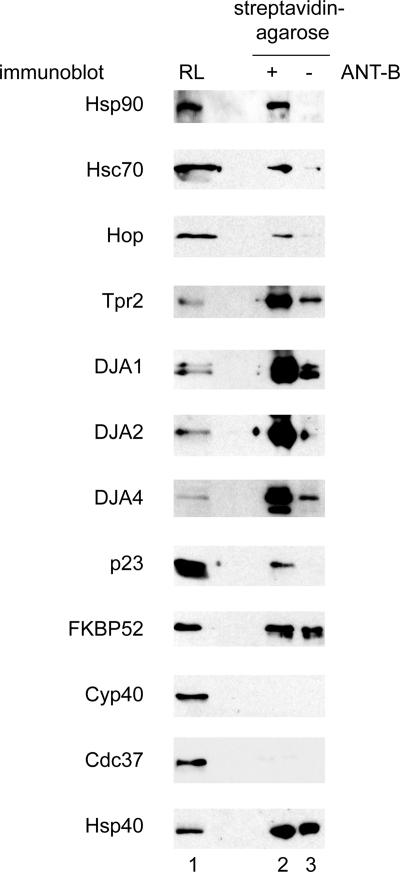
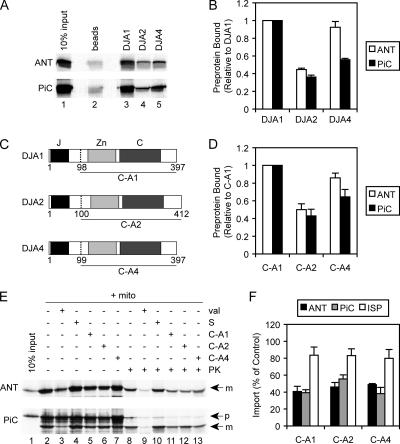
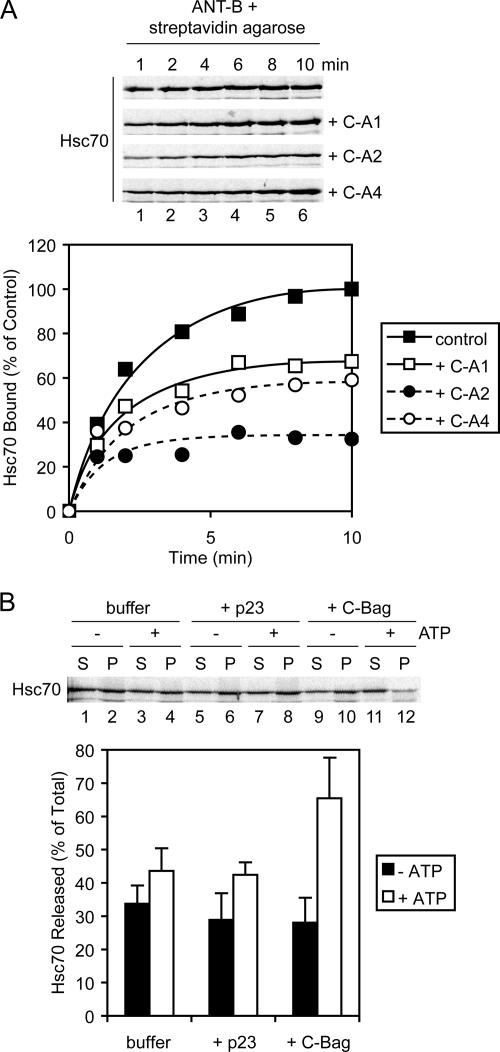
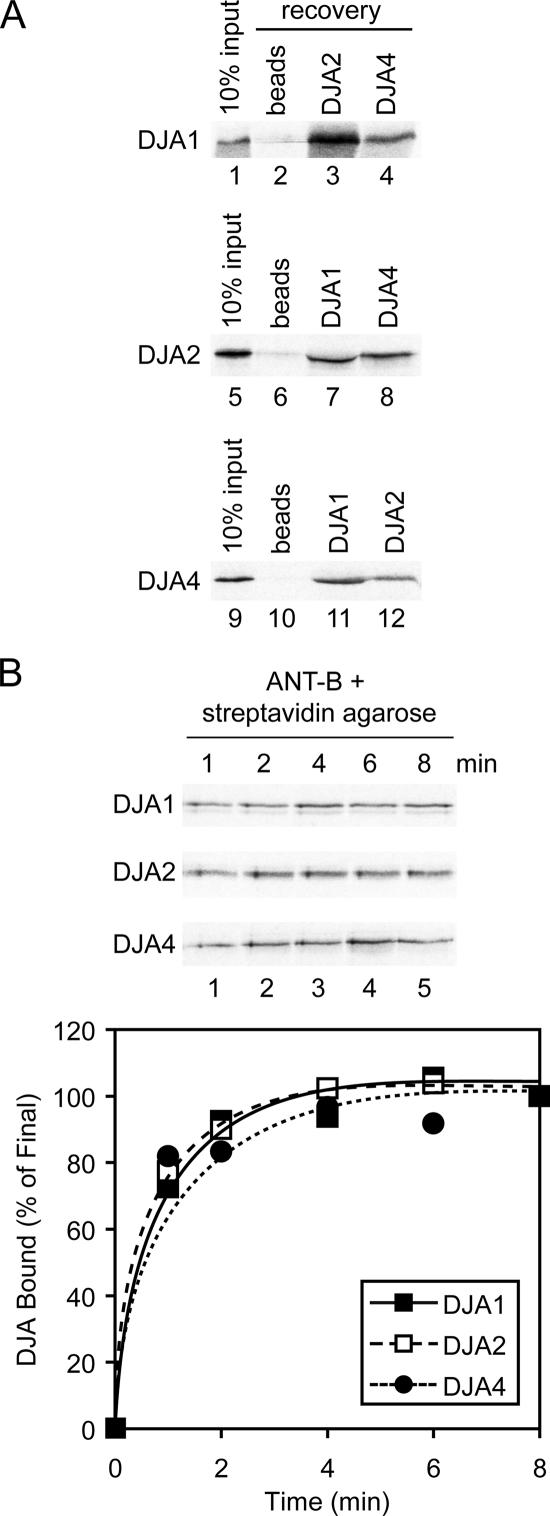
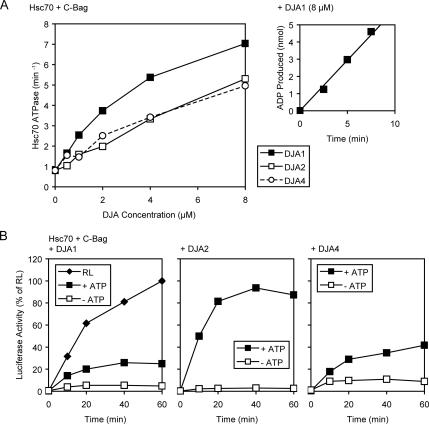
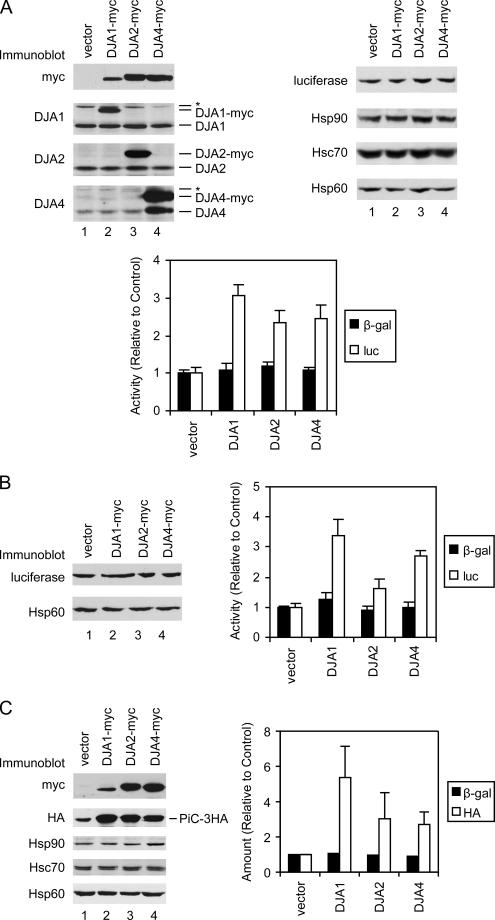
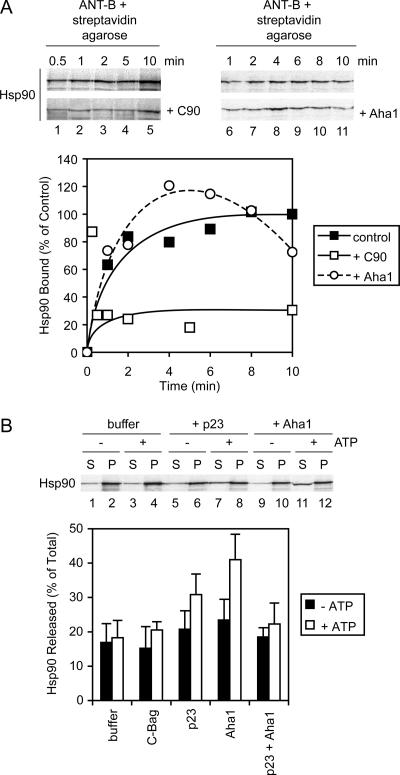
Mitochondrial preproteins that are imported via the translocase of the mitochondrial outer membrane (Tom)70 receptor are complexed with cytosolic chaperones before targeting to the mitochondrial outer membrane. The adenine nucleotide transporter (ANT) follows this pathway, and its purified mature form is identical to the preprotein. Purified ANT was reconstituted with chaperones in reticulocyte lysate, and bound proteins were identified by mass spectrometry. In addition to 70-kDa heat-shock cognate protein (Hsc70) and 90-kDa heat-shock protein (Hsp90), a specific subset of cochaperones were found, but no mitochondria-specific targeting factors were found. Interestingly, three different Hsp40-related J-domain proteins were identified: DJA1, DJA2, and DJA4. The DJAs bound preproteins to different extents through their C-terminal regions. DJA dominant-negative mutants lacking the N-terminal J-domains impaired mitochondrial import. The mutants blocked the binding of Hsc70 to preprotein, but with varying efficiency. The DJAs also showed significant differences in activation of the Hsc70 ATPase and Hsc70-dependent protein refolding. In HeLa cells, the DJAs increased new protein folding and mitochondrial import, although to different extents. No single DJA was superior to the others in all aspects, but each had a profile of partial specialization. The Hsp90 cochaperones p23 and Aha1 also regulated Hsp90-preprotein interactions. We suggest that multiple cochaperones with similar yet partially specialized properties cooperate in optimal chaperone-preprotein complexes.


Figures

Figure 1.
Figure 1.
Mitochondrial import of ANT. (A) ANT (input, lane 1) was radiolabeled by cell-free translation and imported into isolated rat liver mitochondria (+ mito, lanes 2–9). As a negative control, import was abolished with valinomycin (val, lanes 3 and 7). The true extent of import was determined by resistance to added PK (lanes 6–9). Import was assayed in the presence of 20 μM C-90 fragment, a competitor of chaperone-Tom70 interactions (C-90, lanes 4 and 8), or the same mass concentration of bovine serum albumin as a negative control (BSA, lanes 5 and 9). Reactions were analyzed by SDS-PAGE and autoradiography. Right, phosphorimager quantitation of import of ANT, PiC, and ISP are shown relative to control reactions. Standard deviations here, and in all figures, were determined from at least three independent experiments. (B) Import of ANT, PiC, and ISP was assayed upon inhibition with 5 μM C-Bag, treatment with 18 μM GA, or combined inhibition with both reagents, and the quantitation relative to control reactions is shown.
Figure 2.
Figure 2.
Reconstitution of chaperone–ANT complexes. (A) Left, a representative reaction of cell-free translated ANT (lane 1) imported into mitochondria (+ mito, lanes 2–5) as in Figure 1 is shown. Middle, purified ANT was radioiodinated (ANT-I125, lane 6) and diluted into reactions containing RL, ATP, and mitochondria (lanes 7 and 8). Right, purified ANT was biotinylated (ANT-B) and diluted into reactions containing RL, ATP, and mitochondria (lanes 9 and 10), whereas mock reactions contained no ANT-B (lane 11). Negative control reactions were treated with valinomycin (val) to abolish import (lanes 3, 5, 8, and 10). The extent of import was assessed by resistance to PK (lanes 4, 5, 7, 8, and 9–11). (B) Top, ANT was radiolabeled by cell-free translation and resolved on a Superose 6 10/300 GL column. The amount of ANT in each fraction was determined by SDS-PAGE and phosphorimager quantitation, and arbitrary phosphorimager units are represented. The column void volume (V0) and elution volumes of molecular size standards (indicated in kilodaltons) are marked. Bottom, ANT-B was diluted into reactions containing RL and ATP and resolved on the same gel filtration column. The ANT-B in each fraction was detected by SDS-PAGE and streptavidin blots. The elution volume corresponding to the fractions is marked (indicated in milliliters). (C) Molecular weight markers (indicated in kilodaltons) are shown (lane 1) and purified ANT (lane 2), ANT after the biotinylation reaction (ANT-B, lane 3) and removal of excess biotin by desalting (lane 4). ANT-B bound to streptavidin-agarose was incubated in reactions containing RL (lane 5) and ATP. Complexes were recovered and eluted with Laemmli loading buffer (lane 7). Negative control reactions contained no ANT-B or RL (lane 6) or no ANT-B (lane 8). Discrete bands labeled a, b, c, and the range between d and e, were analyzed by mass spectrometry. Bands in the negative control reactions labeled f, g, h, and i also were analyzed.
Figure 3.
Figure 3.
Components of chaperone–ANT complexes. Complexes associated with ANT-B were reconstituted in RL and coprecipitated as in Figure 2C, and then they were analyzed by immunoblots with antibodies against the indicated proteins. Samples shown are total RL (lane 1), ANT-B complexes (lane 2), and negative control reactions lacking ANT-B (lane 3).
Figure 4.
Figure 4.
DJA interaction with preprotein. A, ANT, and PiC were radiolabeled by cell-free translation (lane 1) and coprecipitated with nickel-Sepharose alone (beads, lane 2), or with nickel-Sepharose and purified His-tagged DJA1, DJA2, or DJA4 at a final concentration 5 μM (lanes 3–5). Recovered material was analyzed by SDS-PAGE and autoradiography. (B) Phosphorimager quantitation is shown of the coprecipitation of ANT and PiC with DJA1, DJA2 and DJA4, as in described in A, relative to that with DJA1 set to 1. (C) Diagram of DJA1, DJA2, and DJA4 architecture. J-domain (J, black), zinc finger (Zn, light gray), and C-terminal domains (C, dark gray) are indicated. The start sites of C-A1, C-A2, and C-A4 deletion mutants are marked (dashed line, amino acid numbers indicated). (D) ANT and PiC were coprecipitated with purified His-tagged C-A1, C-A2, and C-A4 as described in A. Phosphorimager quantitation of the coprecipitation is shown, relative to that with C-A1 set to 1. (E) Cell-free translated ANT and PiC (lane 1) were imported into mitochondria (+ mito, lanes 2–13) as described in Figure 1. As a negative control, import was abolished with valinomycin (val, lanes 3 and 9). Reactions were supplemented with 90 mM NaCl alone (S, lanes 4 and 10) or with 20 μM C-A1, C-A2, or C-A4 with 90 mM NaCl (lanes 5–7 and 11–13). The extent of import was assessed by resistance to PK (lanes 8–13). The mature noncleaved form of ANT (m) is visible, as are the precursor (p) and proteolytically cleaved mature (m) forms of PiC. (F) Phosphorimager quantitation is shown of the import of ANT, PiC, and ISP in the presence of 20 μM C-A1, C-A2, or C-A4, as described in E, relative to control reactions with added NaCl.
Figure 5.
Figure 5.
Hsc70-preprotein interactions. (A) Top, Hsc70 was radiolabeled by cell-free translation, incubated with ANT-B immobilized on streptavidin-agarose, and coprecipitated after the indicated times. Reactions contained either no addition, or 20 μM purified C-A1, C-A2, or C-A4. Recovered material was analyzed by SDS-PAGE and autoradiography. Bottom, quantitation of time courses of Hsc70 binding is shown. (B) Top, cell-free translated Hsc70 was coprecipitated with ANT-B as described in A but after 15 min of binding. Samples were resuspended in dissociation reactions with or without ATP, containing buffer alone, or 5 μM purified p23 or C-Bag. After 10 min, released and remaining bound fractions were separated and analyzed. Bottom, quantitation of dissociation reactions.
Figure 6.
Figure 6.
DJA heterocomplex formation. (A) DJA1, DJA2, and DJA4 were radiolabeled by cell-free translation (input, lanes 1, 5, and 9). ANT-B was diluted into reactions containing RL, ATP, and each radiolabeled DJA, as described in Figure 2B. Complexes were coprecipitated (recovery) with nickel-Sepharose alone (beads, lanes 2, 6, and 10) or nickel-Sepharose and the indicated His-tagged DJA protein, as described in Figure 4A. Recovered material was analyzed by autoradiography. (B) Top, DJA1, DJA2, and DJA4 were radiolabeled by cell-free translation and coprecipitated with ANT-B as described in Figure 5A. Bottom, averaged quantitation of time courses of DJA binding are shown.
Figure 7.
Figure 7.
DJA activation of Hsc70. (A) Steady-state ATPase rates of purified Hsc70 were measured in reactions containing 1 mM ATP, 4 μM Hsc70, 20 μM C-Bag, and the indicated concentrations of DJA1, DJA2, or DJA4. Right inset, representative example of the data from which linear rates were calculated. Reactions contained α-[32P]ATP and the amount of ADP produced at each time point was determined by separation on TLC and phosphorimager quantitation. (B) Refolding of guanidine-denatured luciferase was monitored in reactions containing 50% RL and 2 mM ATP, or 4 μM Hsc70, 0.5 μM C-Bag, and 4 μM DJA1, DJA2, or DJA4 as indicated, with or without 2 mM ATP. The activity of luciferase refolded in RL reactions at 60 min was set to 100%.
Figure 8.
Figure 8.
DJA function in cells. (A) HeLa cells were transfected with plasmids expressing luciferase from a CMV promoter, β-galactosidase from an SV40 promoter, and either empty vector or the indicated myc-tagged DJA proteins under a CMV promoter. Two days after transfection, cells were harvested and equivalent amounts of lysate analyzed by immunoblots for the indicated proteins (top) and by enzymatic activity assays (bottom). In blots for DJA1, DJA2, and DJA4, positions of the endogenous and overexpressed myc-tagged proteins are marked. Bands cross-reacting with the antibodies are marked with an asterisk; in cells transfected with myc-tagged DJA4 and detected with antibody against DJA4, a band of similar size to endogenous DJA4 seems to be a proteolytic fragment of the myc-tagged protein. To compare enzymatic activities, the average activities of cells transfected with luciferase (luc), β-galactosidase (β-gal), and empty vector was set to 1. The β-galactosidase activities were then used to correct luciferase activities for variations in transfection. As in all figures, standard deviations were determined from at least three independent experiments. (B) HeLa cells were transfected with plasmids expressing luciferase from a GRE-controlled promoter, constitutive GR-ΔLBD and β-galactosidase, and either empty vector or the indicated myc-tagged DJA proteins as described above. Two days after transfection, cells were analyzed as described above. (C) HeLa cells were transfected with plasmids expressing 3HA-tagged PiC from a chicken β-actin promoter, constitutive β-galactosidase, and either empty vector or the indicated myc-tagged DJA proteins as described above. Two days after transfection, cells were analyzed as described above. Quantitation of the HA immunoblot signal is shown, with that of cells transfected with β-galactosidase and empty vector set to 1.
Figure 9.
Figure 9.
Hsp90–preprotein interactions. (A) Top, Hsp90 was radiolabeled by cell-free translation and coprecipitated with ANT-B as described in Figure 5A. Reactions contained either no addition, or 20 μM purified C-90 or 4 μM Aha1. Bottom, quantitation of time courses of Hsp90 binding is shown. (B) Top, cell-free translated Hsp90 was coprecipitated with ANT-B, and the dissociation of complexes monitored as described in Figure 5B. Dissociation reactions, with or without ATP, contained buffer alone, or 5 μM purified p23 or C-Bag, or 4 μM Aha1, or 5 μM p23 and 4 μM Aha1. Bottom, quantitation of dissociation reactions.

Similar articles

Cited by

References

    1. Abe Y., Shodai T., Muto T., Mihara K., Torii H., Nishikawa S., Endo T., Kohda D. Structural basis of presequence recognition by the mitochondrial protein import receptor Tom20. Cell. 2000;100:551–560. - PubMed
    1. Ali M. M., Roe S. M., Vaughan C. K., Meyer P., Panaretou B., Piper P. W., Prodromou C., Pearl L. H. Crystal structure of an Hsp90-nucleotide-p23/Sba1 closed chaperone complex. Nature. 2006;440:1013–1017. - PMC - PubMed
    1. Borges J. C., Fischer H., Craievich A. F., Ramos C. H. Low resolution structural study of two human HSP40 chaperones in solution. DJA1 from subfamily A and DJB4 from subfamily B have different quaternary structures. J. Biol. Chem. 2005;280:13671–13681. - PubMed
    1. Bose S., Weikl T., Bugl H., Buchner J. Chaperone function of Hsp90-associated proteins. Science. 1996;274:1715–1717. - PubMed
    1. Brix J., Ziegler G. A., Dietmeier K., Schneider-Mergener J., Schulz G. E., Pfanner N. The mitochondrial import receptor Tom 70, identification of a 25 kDa core domain with a specific binding site for preproteins. J. Mol. Biol. 2000;303:479–488. - PubMed

Publication types

MeSH terms

LinkOut - more resources