. 2007 Oct 1;110(7):2276-85.
doi: 10.1182/blood-2007-03-081448. Epub 2007 Jun 27.

Transcription factor Gfi-1 induced by G-CSF is a negative regulator of CXCR4 in myeloid cells

Affiliations

Transcription factor Gfi-1 induced by G-CSF is a negative regulator of CXCR4 in myeloid cells

Maria De La Luz Sierra et al. Blood. .

Abstract

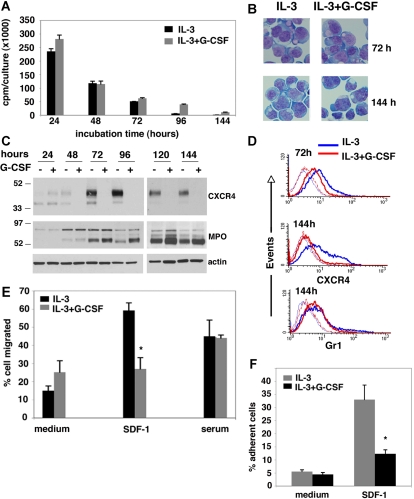
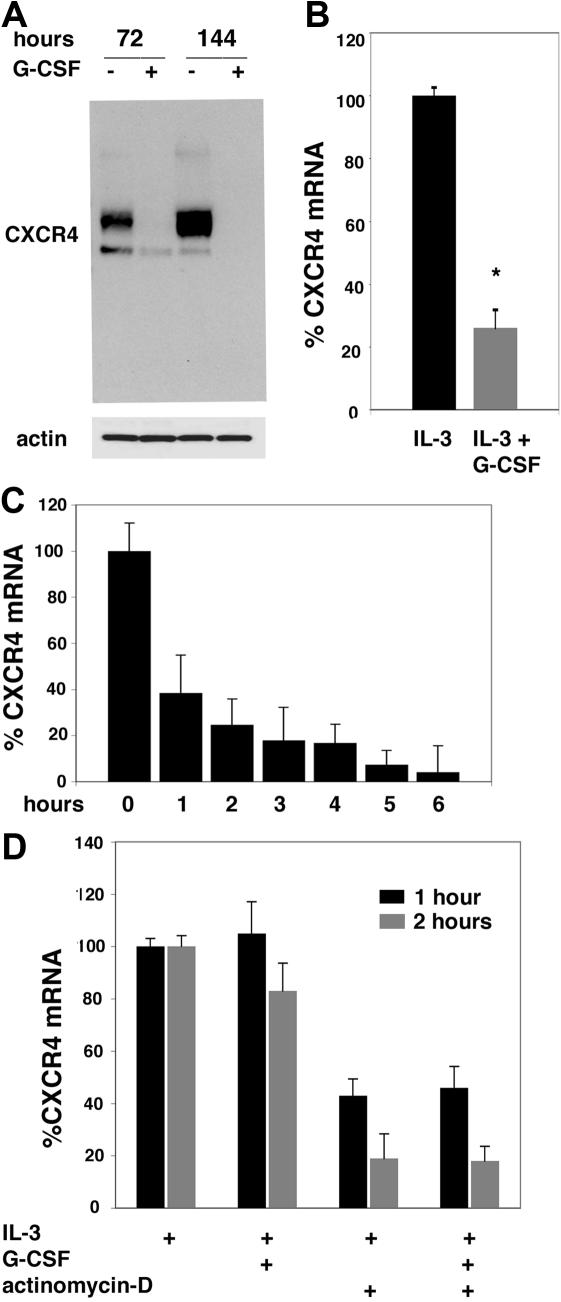
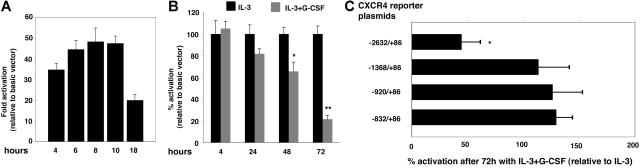
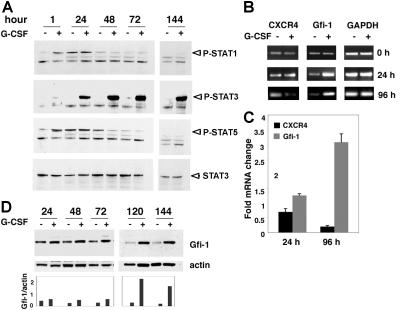
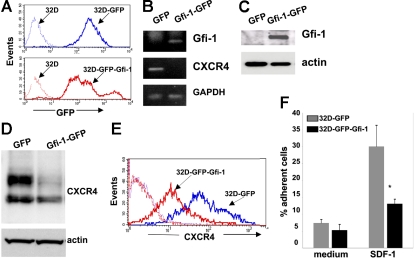
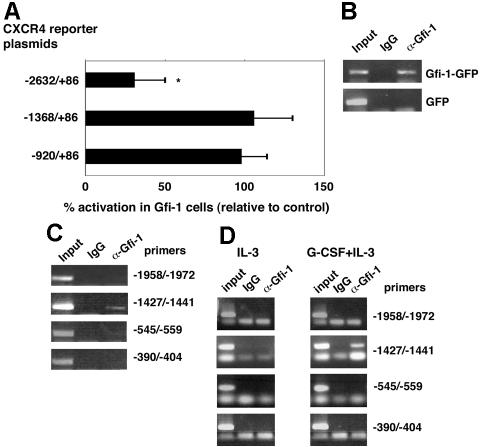
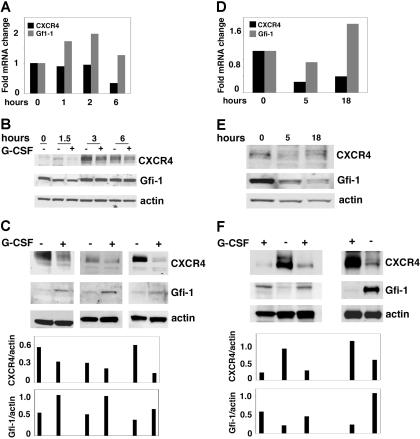
The mechanisms underlying granulocyte-colony stimulating factor (G-CSF)-induced mobilization of granulocytic lineage cells from the bone marrow to the peripheral blood remain elusive. We provide evidence that the transcriptional repressor growth factor independence-1 (Gfi-1) is involved in G-CSF-induced mobilization of granulocytic lineage cells from the bone marrow to the peripheral blood. We show that in vitro and in vivo G-CSF promotes expression of Gfi-1 and down-regulates expression of CXCR4, a chemokine receptor essential for the retention of hematopoietic stem cells and granulocytic cells in the bone marrow. Gfi-1 binds to DNA sequences upstream of the CXCR4 gene and represses CXCR4 expression in myeloid lineage cells. As a consequence, myeloid cell responses to the CXCR4 unique ligand SDF-1 are reduced. Thus, Gfi-1 not only regulates hematopoietic stem cell function and myeloid cell development but also probably promotes the release of granulocytic lineage cells from the bone marrow to the peripheral blood by reducing CXCR4 expression and function.


Figures

Figure 1
Figure 1
Effects of G-CSF on the growth, differentiation, and CXCR4 expression in the IL-3–dependent 32Dcl3 myeloid cells. (A) DNA synthesis in 32Dcl3 cells cultured for 24 to 144 hours in the presence of IL-3 alone or IL-3 plus G-CSF measured by 3H thymidine incorporation. The error bars represent standard deviation (SD) of the mean (triplicate cultures). (B) Microscopic morphology of 32Dcl3 cells cultured for 72 and 144 hours with IL-3 alone or with IL-3 plus G-CSF. Cytospin preparations were stained with May-Grünwald-Giemsa and mounted with PBS/1% glycerol. Cells were visualized through an Eclipse 6600 Nikon microscope (Melville, NY) equipped with a 60×1.40 oil objective (Nikon), and photographed with a Cool Snaps fx Roper Camera (Roper Scientific, Duluth, GA). Images were acquired with IPlab software (Biovision Technologies, Fairfax, VA) and imported into Adobe Photoshop 7.0 software (Adobe, San Jose, CA). (C) Western blot analysis of CXCR4, MPO, and actin content in 32Dcl3 cells cultured for 24 to 144 hours with IL-3 alone or with IL-3 plus G-CSF. The blot was stained with antibodies to CXCR4 then stripped and stained for actin first and then for MPO. (D) Flow cytometric analysis of CXCR4 and Gr-1 surface levels in 32Dcl3 cells cultured with IL-3 alone or IL-3 plus G-CSF for 72 and 144 hours. Background fluorescence with control antibodies is also shown (dotted line). (E) Transwell migration of 32Dcl3 cells in response to recombinant SDF-1α or serum. Cells were precultured for 3 days with IL-3 alone or with IL-3 plus G-CSF. The results (expressed as the percentage of input cells) reflect the mean of 3 experiments, each performed in triplicate. The error bars represent SD of the mean (*P < .05). (F) Attachment of 32Dcl3 cells to wells coated with SDF-1α or medium only. Cells were precultured for 3 days with IL-3 alone or with IL-3 plus G-CSF. The results reflect the means of 3 experiments, each performed in 5 replicates. Results are expressed as the percentage of input cells; error bars represent SD of the mean (*P < .05).
Figure 2
Figure 2
G-CSF regulation of CXCR4 mRNA synthesis. (A) Appearance of CXCR4-related bands evaluated by Western blotting. 32Dcl3 cells were cultured for 3 and 6 days with IL-3 alone or with IL-3 plus G-CSF. (B) CXCR4 mRNA levels were measured by quantitative PCR. 32Dcl3 cells were cultured for 3 days with IL-3 alone or IL-3 plus G-CSF. The results reflect the means of 3 experiments; the error bars reflect SD of the mean (*P < .05). (C) Kinetic of CXCR4 mRNA decay was measured by quantitative PCR. 32Dcl3 cells were cultured for 1 to 6 hours in the presence of actinomycin-D. The results are from a representative experiment and reflect the means of triplicate determinations; the error bars represent SD of the mean. (D) Effects of G-CSF on CXCR4 mRNA decay measured by quantitative PCR. 32Dcl3 cells were cultured for 1 hour or 2 hours with or without actinomycin-D in the presence of IL-3 alone or with IL-3 plus G-CSF. The results (expressed as percentage of CXCR4 mRNA in cells cultured with IL-3 alone) reflect the means of triplicate determinations; the error bars represent SD of the mean.
Figure 3
Figure 3
Effects of G-CSF on CXCR4 promoter activity. (A) Time course of luciferase activity after transfection of 32Dcl3 cells with the CXCR4-promoter reporter plasmid or with the control basic (empty) vector. Cells were cotransfected with Renilla luciferase reference control plasmid to account for variation in transfection efficiencies. The results are expressed as fold activation relative to basic vector after correction for Renilla luciferase activity. The representative (n = 3) results reflect the means of triplicate determinations; the error bars represent SD of the mean. (B) Effects of G-CSF preculture on the luciferase activity induced by CXCR4-promoter reporter plasmid. 32Dcl3 cells were cultured (4-72 hours) with IL-3 alone or with IL-3 plus G-CSF and then transfected with the CXCR4-promoter reporter plasmid or with the basic vector. The results are expressed as the percentage of activation of luciferase activity relative to basic vector after correction for transfection efficiencies as measured by cotransfection with Renilla luciferase control plasmid. Luciferase activation in cells cultured with IL-3 alone was set at 100%. The results reflect the means of 5 experiments; the error bars represent SD of the mean (*P < .05; **P < .02). (C) Luciferase activity after transfection with full-length CXCR4-promoter reporter plasmid and deletion mutants. The results are expressed as the percentage of activation of luciferase activity in 32Dcl3 cells precultured with IL-3 plus G-CSF relative to luciferase activity in cells precultured with IL-3 alone (set at 100%). The results reflect the means of 3 experiments; the error bars represent SD of the mean (*P < .05).
Figure 4
Figure 4
G-CSF induced STAT3 signaling and Gfi-1 expression. (A) Western blot analysis of STAT1, STAT3, and STAT5 phosphorylation in cell lysates of 32Dcl3 cells cultured for 1 to 144 hours with IL-3 alone or with IL-3 plus G-CSF. Blots were first stained for phosphorylated Stat1 and then stripped and reprobed for P-STAT3, PSTAT5, and total STAT3. (B) Semiquantitative RT-PCR analysis of CXCR4, Gfi-1, and GAPDH mRNAs in 32Dcl3 cells before subculture (time 0) or after incubation with IL-3 alone or with IL-3 plus G-CSF for 24 and 96 hours. Representative experiment (n = 5). (C) Real-time RT-PCR analysis of CXCR4 and Gfi-1 mRNA in 32Dcl3 cells after 24 and 96 hours of incubation with IL-3 alone or with IL-3 pus G-CSF. The results reflect the mean fold (± SD) mRNA change in cells cultured with IL-3 plus G-CSF relative to cells cultured in IL-3 alone. (D) Kinetics of G-CSF–induced Gfi-1 protein expression evaluated by Western blotting. 32Dcl3 cells were cultured for 24 to 144 hours with IL-3 alone or with IL-3 plus G-CSF. The blots were stripped and restained for actin. Relative ratios of Gfi-1 to actin are shown in the lower bar graph.
Figure 5
Figure 5
Gfi-1 transduction in 32Dcl3 cells and its effect on CXCR4 expression. (A) GFP expression in 32Dcl3 cells infected with control and Gfi-1 retrovirus was detected by flow cytometry. The profile of noninfected 32Dcl3 cells is also shown (--------). (B) Gfi-1, CXCR4, and GAPDH mRNAs in 32Dcl3 cells infected with control and Gfi-1 retroviruses were detected by semiquantitative RT-PCR. (C) Gfi-1 and actin were detected by Western blotting in cell lysates of 32Dcl3 cells infected with control and Gfi-1 retroviruses; representative results. (D) Western blot analysis of CXCR4 and actin in cell lysates of 32Dcl3 cells infected with control and Gfi-1 retroviruses; representative results. (E) Surface CXCR4 expression in 32Dcl3 cells infected with control and Gfi-1 retroviruses detected by flow cytometry. Background staining with control antibody is shown (--------). (F) Attachment of 32Dcl3 cells infected with control and Gfi-1 retroviruses to wells coated with SDF-1α or medium only. Results are expressed as the percentage of cell input; error bars represent SD of the mean (*P < .05).
Figure 6
Figure 6
CXCR4 promoter activity with Gfi-1 overexpression and Gfi-1 binding to CXCR4 upstream sequences. (A) Luciferase activity after transfection of CXCR4 reporter plasmids in 32Dcl3 cells overexpressing Gfi-1. The results reflect the percentage of the mean activation of luciferase activity in 32Dcl3 cells transduced with Gfi-1 relative to luciferase activity in control-transduced cells (set at 100%). The results reflect the means of 4 experiments; the error bars represent SD of the mean (*P < .05). (B) Representative ChIP results from cell lysates of 32Dcl3 cells overexpressing Gfi-1 (Gfi-1–GFP) or control (GFP). Anti–Gfi-1 antibodies and control IgG were used for immunoprecipitation. The results reflect PCR amplification of genomic sequences upstream of the CXCR4 gene transcription start site (−1427/−1441). (C) PCR results from the indicated primer sets after ChIP of cell lysates from 32Dcl3 cells transduced with Gfi-1; representative results. (D) Cell lysates from 32Dcl3 cells cultured for 3 days with IL-3 alone or with IL-3 plus G-CSF were used for ChIP with antibodies to Gfi-1 or control IgG. Representative PCR results from the indicated primer sets.
Figure 7
Figure 7
In vitro and in vivo effects of G-CSF on CXCR4 and Gfi-1 expression in primary granulocytic lineage cells. (A) CXCR4 and Gfi-1 mRNA levels measured by real-time RT-PCR in Gr1+ bone marrow cells cultured in vitro with G-CSF for 1 hour to 6 hours. The results reflect the relative change in mRNA levels after culture compared with before culture; representative of 3 experiments. (B) CXCR4, Gfi-1, and actin levels detected by immunoblotting in Gr1+ bone marrow cells cultured in vitro with or without G-CSF for 1.5 to 6 hours; representative of 3 experiments. (C) CXCR4, Gfi-1, and actin content in cell lysates of Gr1+ bone marrow-derived cells after 18 hours of culture with G-CSF detected by Western blotting. The results reflect 3 independent experiments. Relative ratios of CXCR4/actin and Gfi-1/actin are shown in the bottom bar graph. (D) RNA was extracted from bone marrow Gr1+ cells from control mice, and mice were injected once with G-SCF 5 and 18 hours earlier. CXCR4 and Gfi-1 mRNA levels detected by real-time RT-PCR. The results reflect the relative change in mRNA levels in Gr1+ cells from mice treated with G-CSF compared with control. (E) Cells lysates were prepared from Gr1+ cells of control mice, and mice were injected once with G-CSF 5 and 18 hours earlier. CXCR4, Gfi-1, and actin levels were detected by immunoblotting. (F) After the mice were treated with G-CSF or diluent daily for 5 days, Gr1+ cells were purified from the bone marrow, and their content of CXCR4, Gfi-1, and actin were evaluated by Western blotting. The results are from 3 independent experiments. Relative ratios of CXCR4/actin and Gfi-1/actin are shown in the bottom bar graph.

Similar articles

Cited by

References

    1. Lieschke GJ, Grail D, Hodgson G, et al. Mice lacking granulocyte colony-stimulating factor have chronic neutropenia, granulocyte and macrophage progenitor cell deficiency, and impaired neutrophil mobilization. Blood. 1994;84:1737–1746. - PubMed
    1. Liu F, Wu HY, Wesselschmidt R, Kornaga T, Link DC. Impaired production and increased apoptosis of neutrophils in granulocyte colony-stimulating factor receptor-deficient mice. Immunity. 1996;5:491–501. - PubMed
    1. Druhan LJ, Ai J, Massullo P, Kindwall-Keller T, Ranalli MA, Avalos BR. Novel mechanism of G-CSF refractoriness in patients with severe congenital neutropenia. Blood. 2005;105:584–591. - PubMed
    1. Ward AC, van Aesch YM, Gits J, et al. Novel point mutation in the extracellular domain of the granulocyte colony-stimulating factor (G-CSF) receptor in a case of severe congenital neutropenia hyporesponsive to G-CSF treatment. J Exp Med. 1999;190:497–507. - PMC - PubMed
    1. Cohen AM, Zsebo KM, Inoue H, et al. In vivo stimulation of granulopoiesis by recombinant human granulocyte colony-stimulating factor. Proc Natl Acad Sci U S A. 1987;84:2484–2488. - PMC - PubMed

Publication types

MeSH terms