. 2008 Jun;29(6):671-82.
doi: 10.1002/hbm.20428.

Low frequency BOLD fluctuations during resting wakefulness and light sleep: a simultaneous EEG-fMRI study

Affiliations

Low frequency BOLD fluctuations during resting wakefulness and light sleep: a simultaneous EEG-fMRI study

Silvina G Horovitz et al. Hum Brain Mapp. 2008 Jun.

Abstract

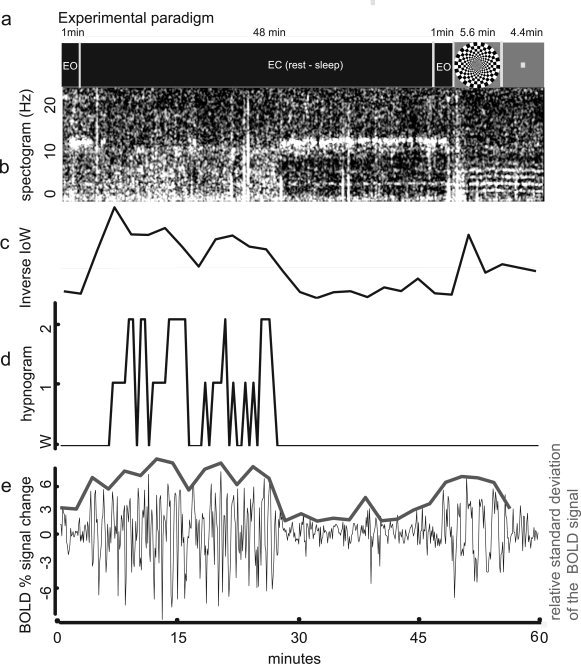
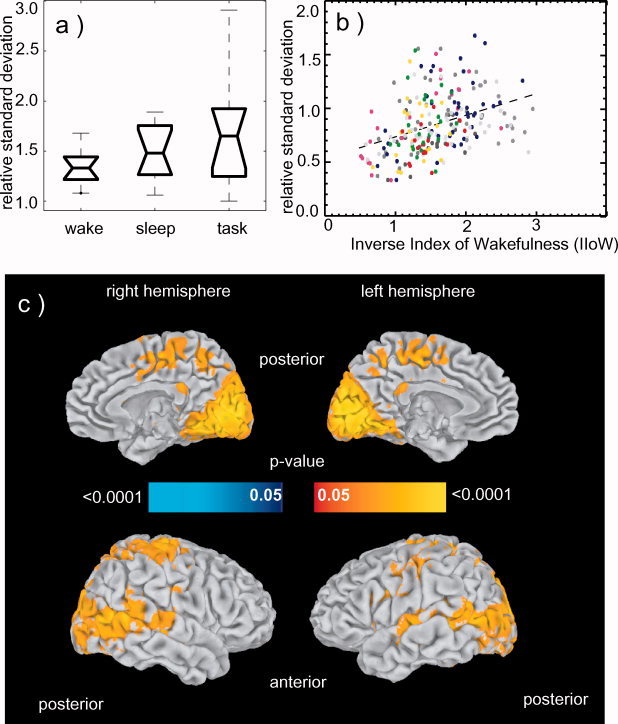
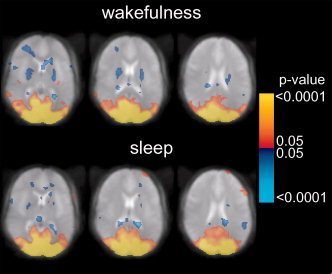
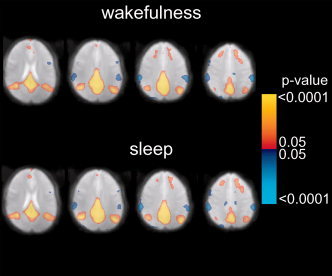
Recent blood oxygenation level dependent functional MRI (BOLD fMRI) studies of the human brain have shown that in the absence of external stimuli, activity persists in the form of distinct patterns of temporally correlated signal fluctuations. In this work, we investigated the spontaneous BOLD signal fluctuations during states of reduced consciousness such as drowsiness and sleep. For this purpose, we performed BOLD fMRI on normal subjects during varying levels of consciousness, from resting wakefulness to light (non-slow wave) sleep. Depth of sleep was determined based on concurrently acquired EEG data. During light sleep, significant increases in the fluctuation level of the BOLD signal were observed in several cortical areas, among which visual cortex was the most significant. Correlations among brain regions involved with the default-mode network persisted during light sleep. These results suggest that activity in areas such as the default-mode network and primary sensory cortex, as measured from BOLD fMRI fluctuations, does not require a level of consciousness typical of wakefulness.


Figures

Figure 1
Figure 1
Experimental paradigm and sample time course data from one subject. (a) Timing of the scan paradigm. One minute of rest with eyes open (EO) was followed by 48 min of eyes closed (EC), during which the subject was allowed to sleep. This was followed by another minute of EO, and 5.6 min of checkerboard stimulation and 4.4 min of center dot fixation for a total scan time of 60 min. (b) EEG spectrogram: time‐frequency spectrum of the data from one subject at electrode C3. Notice elevated alpha activity (8–12 Hz) ‐indicating wakefulness‐ at the beginning, then slowing towards extended theta (2–7 Hz) ‐ indicating sleep‐ and just before minute 30 returning to predominantly alpha activity. (c) Inverse index of wakefulness (IIoW): Larger values represent lower frequencies in the EEG, which are associated with sleep. (d) Hypnogram: Sleep score, over 30 s intervals, as assessed by sleep expert (TJB). Higher scores indicate deeper sleep (Rechtschaffen and Kales, 1968). (e) fMRI time course: average percentage signal change in the VC ROI, defined from the response to the visual task. Overlay: relative standard deviation of the BOLD signal change in the VC ROI, in 2 min (20 images) intervals, data offset vertically by 3 units for display purposes.
Figure 2
Figure 2
Power spectral density of the BOLD time course in the VC ROI computed for 11 subjects over the entire (48 min) resting period.
Figure 3
Figure 3
BOLD fluctuation differences between sleep and wakefulness (n = 11). (a) Boxplot of the relative BOLD signal fluctuation levels in VC during resting wakefulness, sleep and task. The boxes have lines at the lower quartile, median, and upper quartile values. The whiskers are lines extending from each end of the box to show the extent of the rest of the data. These data have no outliers. (b) Relationship between fluctuation level of the BOLD signal and IIoW in the visual cortex ROI. Scatter plot shows relative standard deviation of the BOLD percentage signal change averaged over the VC ROI, versus IIoW. Each point is obtained as an average over 2 min intervals (that is over 20 TRs). Two hundred and thirty‐five points derived from eleven subjects are presented (22 intervals per subject, two subjects contributed 17 and 19 points respectively due to shorter scans). Each color represents a volunteer. The regression curve is shown by the dotted line. Correlation coefficient = 0.37, F (11,223) = 12.139, P < 0.025). (c) Relationship between fluctuation level of the BOLD signal and IIoW across the entire brain. Correlations between relative standard deviation of the BOLD percentage signal change in each voxel and IIoW converted to p‐values and shown on inflated brain. Yellow‐red tones indicate areas where fluctuations are larger during sleep compared to wakefulness (larger IIoW). A widespread distribution of this effect is seen in visual cortex, primary auditory cortex, and precuneus among other areas. Blue tones (not seen) indicate areas where fluctuations during wakefulness were larger than during sleep.
Figure 4
Figure 4
Statistical composite maps (n = 6) showing the temporal correlation of the percentage BOLD signal change with the mean time course in the VC ROI during wakefulness (top) and sleep (bottom). Color scale represents p‐values, thresholded at P = ±0.05 (corrected). Positive (red‐yellow) and negative (blue) correlations are shown.
Figure 5
Figure 5
Statistical composite maps (n = 6) showing the temporal correlation of the percentage BOLD signal change with the seed in the posterior cingulate ROI during wakefulness (top) and sleep (bottom). Four representative axial slices show similar default‐mode network correlations during wakefulness and light sleep. Color scale represents p‐values, thresholded at P = ±0.05 (corrected). Positive (red‐yellow) and negative (blue) correlations are shown.

Similar articles

Cited by

References

    1. Allen PJ, Josephs O, Turner R ( 2000): A method for removing imaging artifact from continuous EEG recorded during functional MRI. Neuroimage 12: 230–239. - PubMed
    1. Andersson JL, Onoe H, Hetta J, Lidstrom K, Valind S, Lilja A, Sundin A, Fasth KJ, Westerberg G, Broman JE, Watanabe Y, Langstrom B. ( 1998): Brain networks affected by synchronized sleep visualized by positron emission tomography. J Cereb Blood Flow Metab 18: 701–715. - PubMed
    1. Arfanakis K, Cordes D, Haughton VM, Moritz CH, Quigley MA, Meyerand ME ( 2000): Combining independent component analysis and correlation analysis to probe interregional connectivity in fMRI task activation datasets. Magn Reson Imaging 18: 921–930. - PubMed
    1. Arieli A, Sterkin A, Grinvald A, Aertsen A ( 1996): Dynamics of ongoing activity: Explanation of the large variability in evoked cortical responses. Science 273: 1868–1871. - PubMed
    1. Bandettini PA, Wong EC, Hinks RS, Tikofsky RS, Hyde JS ( 1992): Time course EPI of human brain function during task activation. Magn Reson Med 25: 390–397. - PubMed

Publication types