

New chemically induced skin tumour susceptibility loci identified in a mouse backcross between FVB and dominant resistant PWK
- PMID: 17598916
- PMCID: PMC1948013
- DOI: 10.1186/1471-2156-8-39
New chemically induced skin tumour susceptibility loci identified in a mouse backcross between FVB and dominant resistant PWK
Abstract
Background: A variety of skin cancer susceptibility among mouse strains has allowed identification of genes responsible for skin cancer development. Fifteen Skts loci for skin tumour susceptibility have been mapped so far by using the two-stage skin carcinogenesis model [induced by 7.12-dimethylbenz(a)anthracene (DMBA)/12-O-tetradecanoylphorbol-13-acetate (TPA)]. A few responsible genes have been identified using wild-derived dominant resistant Mus spretus mice, and one has been confirmed as a low penetrance cancer susceptibility gene in a variety of human cancers.
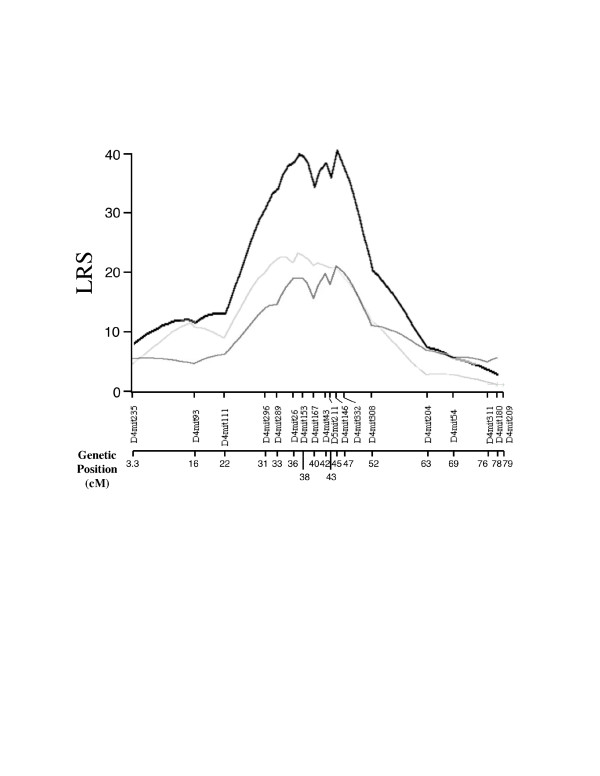
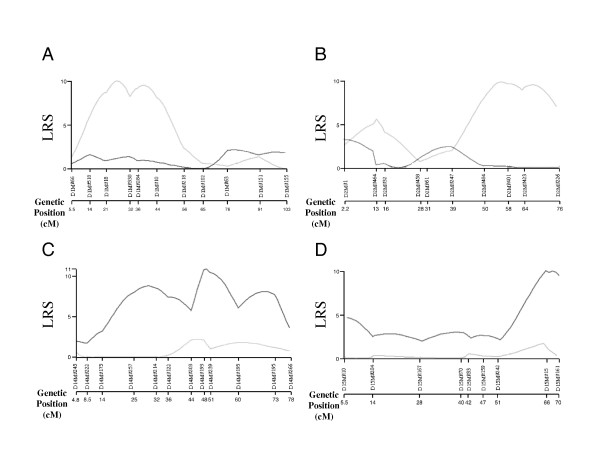
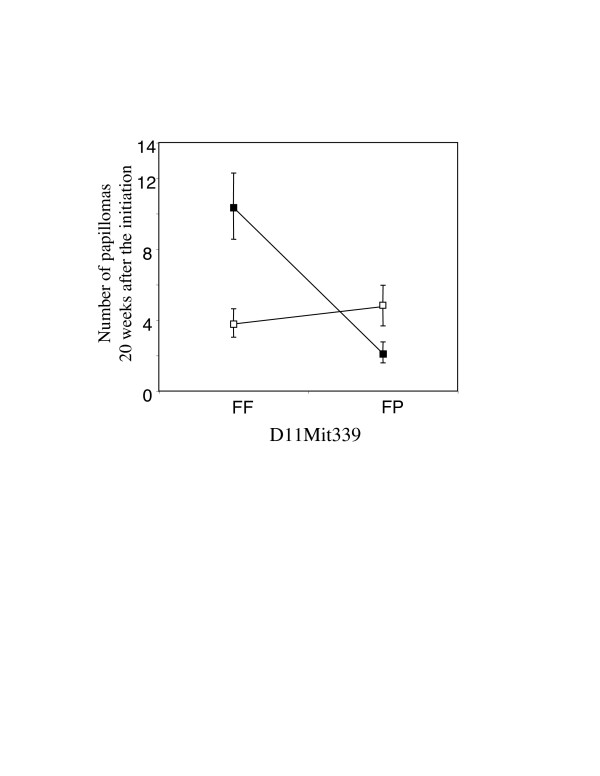
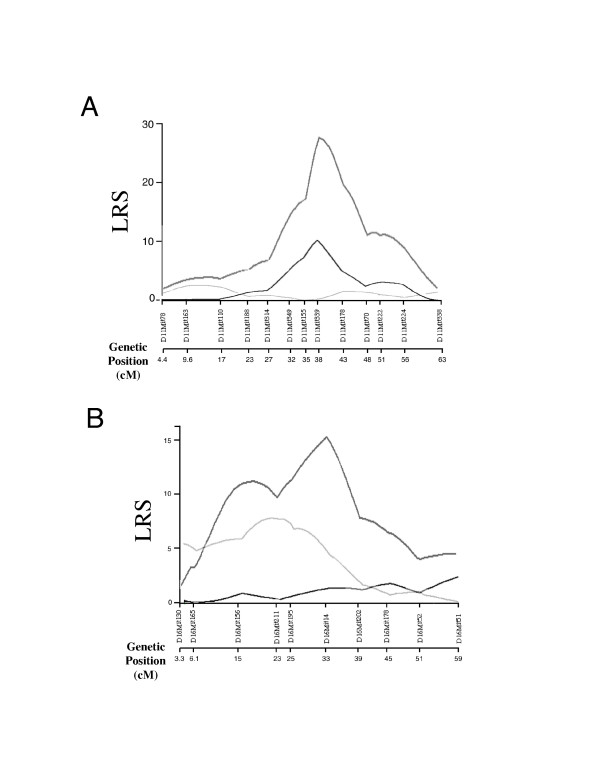
Results: In the present study, we found that wild-derived PWK mice developed no tumour by treatment with the two-stage skin carcinogenesis protocol. This phenotype is dominant resistant when crossed with the highly susceptible strain FVB. By analyzing the F1 backcross generation between PWK and FVB, we found empirical evidence of significant linkage at the new loci Skts-fp1 on chromosome 4 and suggestive linkage on chromosomes 1, 3, 11, 12 and 14 for skin tumour susceptibility. Skts-fp1 includes the Skts7 interval, which was previously mapped by a Mus spretus and NIH backcross. We also observed suggestive linkage on chromosomes 1 and 2 in the female population only, while suggestive linkage on chromosomes 14 and 15 only was observed in the male population. A significant genetic interaction was seen between markers of D11Mit339 and D16Mit14.
Conclusion: Analysis of this new cross may facilitate the identification of genes responsible for mouse skin cancer susceptibility and may reveal their biological interactions.
Figures
Similar articles
-
Mapping of new skin tumor susceptibility loci by a phenotype-driven congenic approach.Oncol Lett. 2018 Nov;16(5):6670-6676. doi: 10.3892/ol.2018.9495. Epub 2018 Sep 24. Oncol Lett. 2018. PMID: 30405807 Free PMC article.
-
Independent genetic control of early and late stages of chemically induced skin tumors in a cross of a Japanese wild-derived inbred mouse strain, MSM/Ms.Carcinogenesis. 2012 Nov;33(11):2260-8. doi: 10.1093/carcin/bgs250. Epub 2012 Jul 28. Carcinogenesis. 2012. PMID: 22843548
-
New outbred colony derived from Mus musculus castaneus to identify skin tumor susceptibility loci.Mol Carcinog. 2010 Jul;49(7):653-61. doi: 10.1002/mc.20635. Mol Carcinog. 2010. PMID: 20564342 Free PMC article.
-
Multigenic control of skin tumour development in mice.Ciba Found Symp. 1996;197:156-68; discussion 168-80. doi: 10.1002/9780470514887.ch9. Ciba Found Symp. 1996. PMID: 8827373 Review.
-
Genetic susceptibility to tumor progression in mouse skin carcinogenesis.Prog Clin Biol Res. 1996;395:47-55. Prog Clin Biol Res. 1996. PMID: 8895983 Review. No abstract available.
Cited by
-
The Japanese Wild-Derived Inbred Mouse Strain, MSM/Ms in Cancer Research.Cancers (Basel). 2021 Mar 1;13(5):1026. doi: 10.3390/cancers13051026. Cancers (Basel). 2021. PMID: 33804471 Free PMC article. Review.
-
Multi-stage chemical carcinogenesis in mouse skin: fundamentals and applications.Nat Protoc. 2009;4(9):1350-62. doi: 10.1038/nprot.2009.120. Epub 2009 Aug 27. Nat Protoc. 2009. PMID: 19713956 Free PMC article.
-
Identification of Stmm3 locus conferring resistance to late-stage chemically induced skin papillomas on mouse chromosome 4 by congenic mapping and allele-specific alteration analysis.Exp Anim. 2014;63(3):339-48. doi: 10.1538/expanim.63.339. Exp Anim. 2014. PMID: 25077764 Free PMC article.
-
Congenic mapping and allele-specific alteration analysis of Stmm1 locus conferring resistance to early-stage chemically induced skin papillomas.PLoS One. 2014 May 20;9(5):e97201. doi: 10.1371/journal.pone.0097201. eCollection 2014. PLoS One. 2014. PMID: 24844776 Free PMC article.
-
Mapping of new skin tumor susceptibility loci by a phenotype-driven congenic approach.Oncol Lett. 2018 Nov;16(5):6670-6676. doi: 10.3892/ol.2018.9495. Epub 2018 Sep 24. Oncol Lett. 2018. PMID: 30405807 Free PMC article.
References
Publication types
MeSH terms
Substances
Grants and funding
LinkOut - more resources
Full Text Sources
Medical
Molecular Biology Databases
Research Materials
