. 2007 Jul 25;26(14):3397-409.
doi: 10.1038/sj.emboj.7601777. Epub 2007 Jun 28.

BLM is required for faithful chromosome segregation and its localization defines a class of ultrafine anaphase bridges

Affiliations

BLM is required for faithful chromosome segregation and its localization defines a class of ultrafine anaphase bridges

Kok-Lung Chan et al. EMBO J. .

Abstract

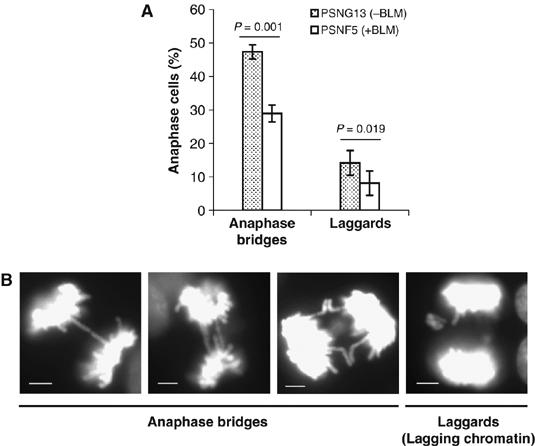
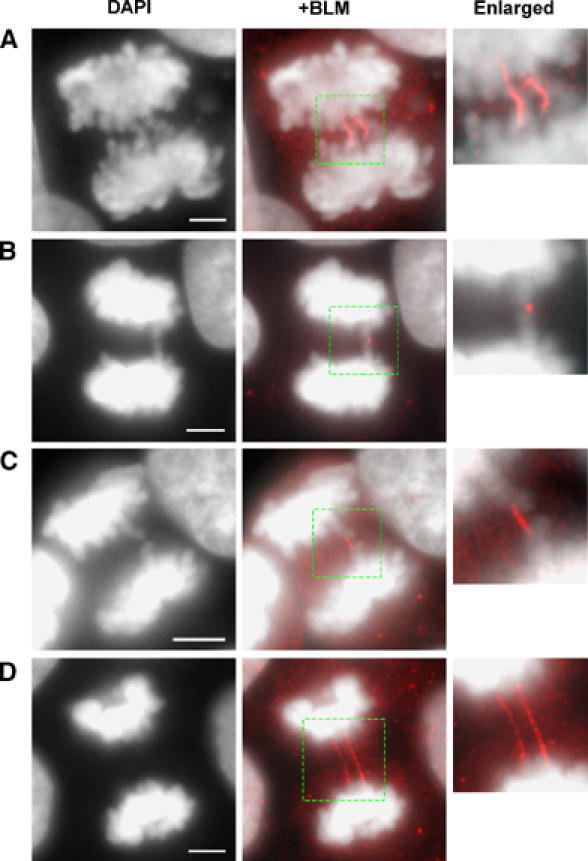
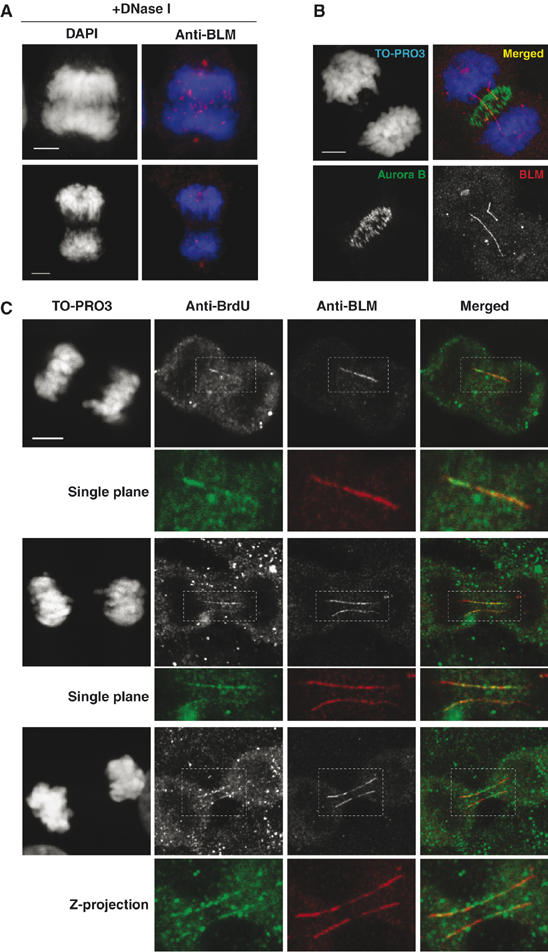
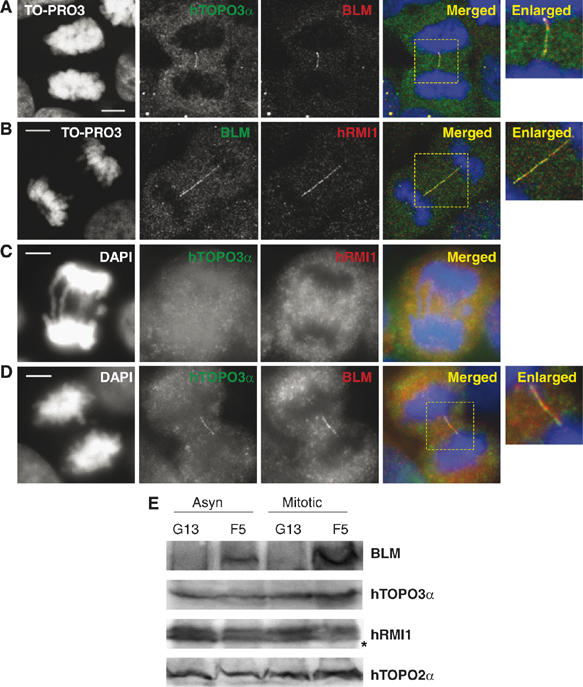
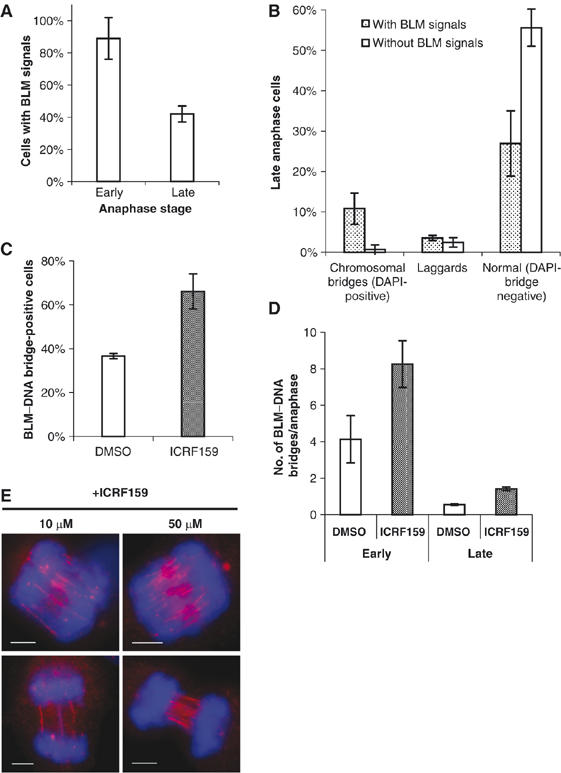
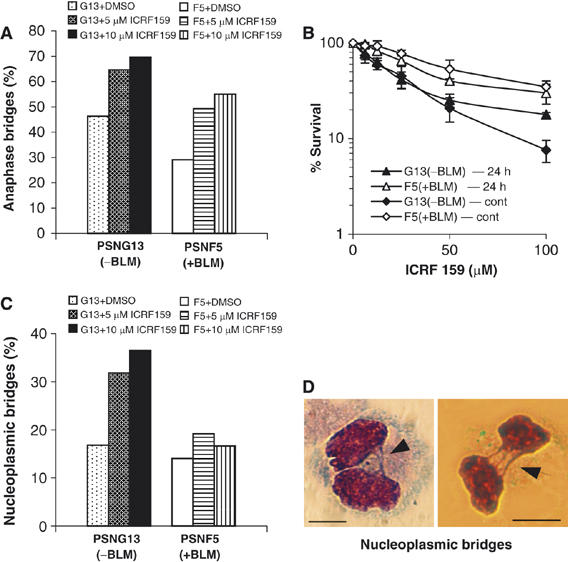
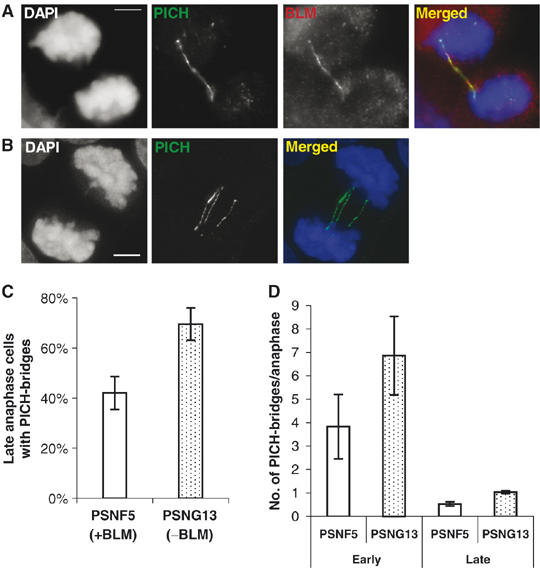
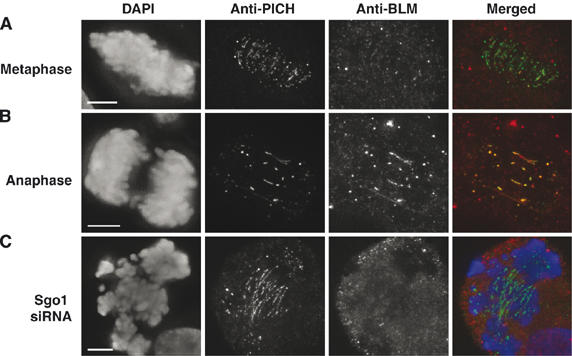
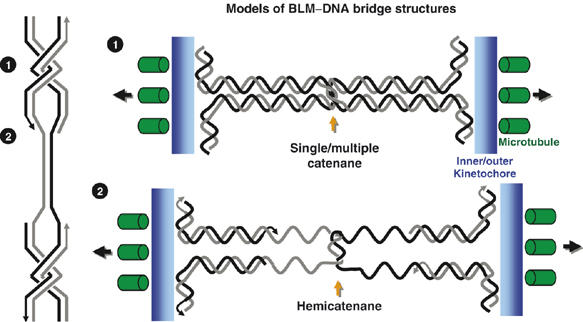
Mutations in BLM cause Bloom's syndrome, a disorder associated with cancer predisposition and chromosomal instability. We investigated whether BLM plays a role in ensuring the faithful chromosome segregation in human cells. We show that BLM-defective cells display a higher frequency of anaphase bridges and lagging chromatin than do isogenic corrected derivatives that eptopically express the BLM protein. In normal cells undergoing mitosis, BLM protein localizes to anaphase bridges, where it colocalizes with its cellular partners, topoisomerase IIIalpha and hRMI1 (BLAP75). Using BLM staining as a marker, we have identified a class of ultrafine DNA bridges in anaphase that are surprisingly prevalent in the anaphase population of normal human cells. These so-called BLM-DNA bridges, which also stain for the PICH protein, frequently link centromeric loci, and are present at an elevated frequency in cells lacking BLM. On the basis of these results, we propose that sister-chromatid disjunction is often incomplete in human cells even after the onset of anaphase. We present a model for the action of BLM in ensuring complete sister chromatid decatenation in anaphase.


Figures

Figure 1
Figure 1
BS cells exhibit chromosome missegregation. (A) Percentage of anaphases from PSNF5 (+BLM) and PSNG13 (vector alone) cells that display anaphase bridges or lagging chromosomes. Determinations were performed in triplicate (n⩾600 anaphase cells in each case) and error bars represent standard deviations from the mean. Significance was calculated by using a two-tailed student t-test. (B) Representative images of DAPI-stained PSNG13 cells showing examples of anaphase bridges and lagging chromosomes, as indicated below the images. Scale bars, 5 μm.
Figure 2
Figure 2
BLM localizes to anaphase bridges. Representative immunofluorescence images using the anti-BLM antibody (C-18) showing the localization of BLM to anaphase bridges in the SV40-transformed human fibroblast cell line, GM00637. In each case, the boxed region is enlarged on the right. BLM localizes to DAPI-stained chromosomal bridges (A), as a focus on the tips of two dense chromatin regions (B), as a short connecting bridge from the arms of two dense chromatin regions (C) and on bridges that are undetectable by DAPI staining (D). Scale bars, 5 μm.
Figure 3
Figure 3
BLM–DNA bridges are composed of DNA and do not represent a cytoskeletal structure. (A) Representative images of anaphases in which the samples were treated with DNase I before microscopy. Note the absence of BLM staining on any bridge structure. (B) Z-projection of eight stacking confocal images showing the lack of colocalization of BLM (red) to the mitotic midzone, as revealed by staining for Aurora B (green). (C) Representative confocal microscopy images of late anaphase GM00637 cells showing TO-PRO3-negative, BLM–DNA bridges (red) that colocalize with staining for BrdU (green). The top and middle examples are images from a single optical plane, whereas the bottom example indicates a Z-projection of six sequential confocal stacks with a 0.3 μm interval. Scale bars, 5 μm.
Figure 4
Figure 4
Topoisomerase IIIα (hTOPO3α) and hRMI1 colocalize with BLM to anaphase bridges and their localization is dependent upon BLM. (A) Colocalization of BLM (red) and hTOPO3α (green) to anaphase bridges in GM00637 cells. The merged image shows yellow fluorescence, where the two signals coincide. (B) Colocalization of hRMI1 (red) and BLM (green). (C) hTOPO3α and hRMI1 are absent from anaphase bridges in the GM08505 BS cell line. (D) Stable expression of BLM (red) in GM08505 cells (to generate PSNF5) causes hTOPO3α protein (green) to relocalize to anaphase bridges. (E) Western blot of asynchronous and mitotic PSNG13 (vector-only transfectant) and PSNF5 (+BLM) cells showing that expression of BLM is found in PSNF5 cells only, and that PSNF5 and PSNG13 cells express equivalent levels of hTOPO3α and hRMI1. The asterisk denotes a nonspecific band detected by the anti-hRMI1 antibody (Yin et al, 2005). Topoisomerase IIα (hTOPO2α) was used as a loading control. Scale bars, 5 μm.
Figure 5
Figure 5
BLM–DNA bridges are commonly found in normal human cells and their prevalence can be increased by treatment with topoisomerase II inhibitors. (A) Quantification of the percentage of early and late anaphase GM00637 cells exhibiting BLM staining of bridge DNA. (B) Quantification of the percentage of late anaphase cells that exhibit either no BLM staining or BLM-positive staining on DAPI-positive chromosomal bridges, on lagging chromatin, or on apparently normal (no DAPI-positive bridges) anaphases. Lagging chromatin was scored as positive if it exhibited BLM staining or contained a BLM–DNA bridge. Experiments were performed in triplicate and error bars represent standard deviations. Over 300 anaphase cells in each case were analyzed. (C) Effect of ICRF-159 (10 μM) or solvent alone on the percentage of late anaphase cells displaying at least one BLM–DNA bridge. (D) As in (C), except quantification of the average number of BLM–DNA bridges per anaphase. (E) Representative anaphase cells showing multiple BLM–DNA bridges after treatment with 10 or 50 μM ICRF-159 for 24 h. Scale bars, 5 μm.
Figure 6
Figure 6
Inhibition of topoisomerase II exacerbates chromosome segregation defects in BS cells. (A) Percentage of PSNG13 and PSNF5 anaphase cells (n=>200 cells in each case) that exhibit DAPI-stained anaphase bridges in the absence of ICRF-159 or after exposure to 5 or 10 μM ICRF-159 for 24 h. (B) Clonogenic survival analysis of PSNG13 (vector alone) and PSNF5 (+BLM) cells following a 24 h or continuous (cont) exposure to ICRF-159. Analyses were performed in triplicate. Data points are the means and error bars represent standard deviations. (C) Percentage of cytokinesis-blocked PSNF5 and PSNG13 cells (n⩾1000 cells in each case) that exhibit nucleoplasmic bridges under the conditions for (A). (D) Representative images of binucleated PSNG13 cells showing examples of nucleoplasmic bridges (arrows). Scale bars, 10 μm.
Figure 7
Figure 7
BLM-deficient cells exhibit an increased frequency of DNA bridges revealed by PICH staining. (A) A representative example showing the colocalization of PICH and BLM to a DAPI-negative BLM–DNA bridge in GM00637 cells. (B) Z-projection of multiple deconvoluted stacking images showing that the localization of PICH to DAPI-negative DNA bridges is observed in PSNG13 cells lacking BLM. (C) Quantification of the percentage of late anaphase cells of the isogenic PSNF5 (+BLM) and PSNG13 (−BLM) pair that exhibit DAPI-negative PICH bridges. (D) Quantification of the average number of PICH bridges per anaphase in PSNG13 and PSNFG5 cells. Analyses were performed in triplicate. Data points are the means and error bars represent standard deviations. Over 100 anaphase cells in each case were analyzed.
Figure 8
Figure 8
BLM is only recruited to DNA bridges in anaphase. (A) Z-projections of deconvolution images showing a metaphase GM00637 cell with PICH staining on centromeres and short bridges (green), but virtually no BLM staining (red). (B) As in (A), but on a mid-anaphase cell. Note the appearance of BLM staining on the bridges in this panel. (C) PICH, but not BLM, localizes to DNA bridges observed in early mitotic HeLa cells in which Sgo1 has been depleted to induce premature centromeric disjunction.
Figure 9
Figure 9
Model for the generation of BLM–DNA bridges. We propose that the BLM–DNA bridges arise during DNA replication as either (1) fully replicated, but still intertwined duplexes (cantenanes) or (2) partially replicated, hemicatenated DNA, that could arise at sites of converging replication forks. A high proportion of the bridge structures link kinetochores (blue), where Hec1 binds, and which attach to microtubules (green) that are under tension (black arrows).

References

    1. Baumann C, Korner R, Hofmann K, Nigg EA (2007) PICH, a centromere-associated SNF2 family ATPase, is regulated by Plk1 and required for the spindle checkpoint. Cell 128: 101–114 - PubMed
    1. Beamish H, Kedar P, Kaneko H, Chen P, Fukao T, Peng C, Beresten S, Gueven N, Purdie D, Lees-Miller S, Ellis N, Kondo N, Lavin MF (2002) Functional link between BLM defective in Bloom's syndrome and the ataxia-telangiectasia-mutated protein, ATM. J Biol Chem 277: 30515–30523 - PubMed
    1. Bennink ML, Leuba SH, Leno GH, Zlatanova J, de Grooth BG, Greve J (2001) Unfolding individual nucleosomes by stretching single chromatin fibers with optical tweezers. Nat Struct Biol 8: 606–610 - PubMed
    1. Bischof O, Kim SH, Irving J, Beresten S, Ellis NA, Campisi J (2001) Regulation and localization of the Bloom syndrome protein in response to DNA damage. J Cell Biol 153: 367–380 - PMC - PubMed
    1. Branzei D, Sollier J, Liberi G, Zhao X, Maeda D, Seki M, Enomoto T, Ohta K, Foiani M (2006) Ubc9- and mms21-mediated sumoylation counteracts recombinogenic events at damaged replication forks. Cell 127: 509–522 - PubMed

Publication types

MeSH terms