. 2007 Sep 1;583(Pt 2):581-92.
doi: 10.1113/jphysiol.2007.130294. Epub 2007 Jun 28.

Cue-invariant detection of centre-surround discontinuity by V1 neurons in awake macaque monkey

Affiliations

Cue-invariant detection of centre-surround discontinuity by V1 neurons in awake macaque monkey

Zhi-Ming Shen et al. J Physiol. .

Abstract

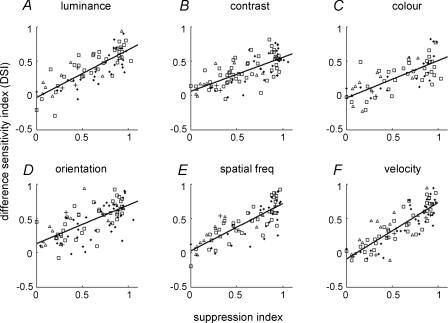
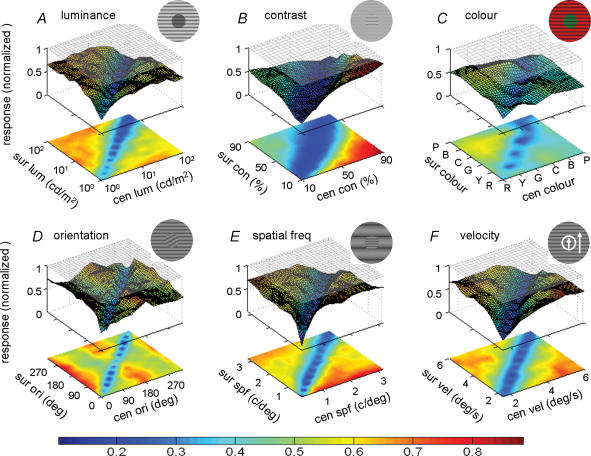
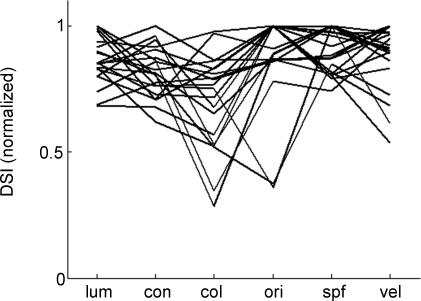
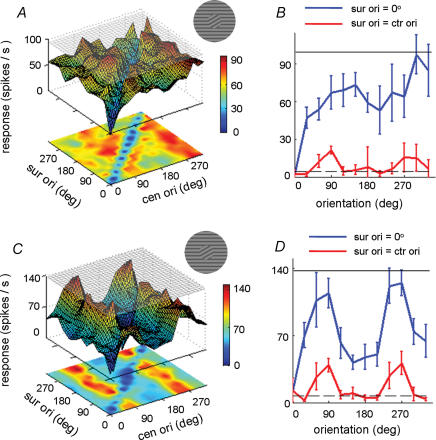
Visual perception of an object depends on the discontinuity between the object and its background, which can be defined by a variety of visual features, such as luminance, colour and motion. While human object perception is largely cue invariant, the extent to which neural mechanisms in the primary visual cortex contribute to cue-invariant perception has not been examined extensively. Here we report that many V1 neurons in the awake monkey are sensitive to the stimulus discontinuity between their classical receptive field (CRF) and non-classical receptive field (nCRF) regardless of the visual feature that defines the discontinuity. The magnitude of this sensitivity is strongly dependent on the strength of nCRF suppression of the cell. These properties of V1 neurons may contribute significantly to cue-invariant object perception.


Figures

Figure 7
Figure 7. Centre–surround discontinuity sensitivity with large centre stimulus patch
A, the distribution of the eye positions during visual stimulation. The fixation window is 0.8 deg. The upper and right panels are the histograms of the x and y eye positions, respectively. B, definition of the CRF, measured by the responses to a small rectangular strip (typically, 1 deg × 0.1 deg) at different positions. Horizontal dashed/dotted line represents spontaneous firing rate. Vertical dashed lines indicate CRF borders, and red arrow indicates CRF centre. C, surface–contour plots showing the responses of the cell to stimuli with centre–surround velocity discontinuity. The CRF size of this cell is 2.2 deg × 2.0 deg; the centre grating size is 4 deg. The difference in response between the diagonal and off-diagonal regions is statistically significant (P < 0.001, Mann–Whitney U test).
Figure 1
Figure 1. Schematic depiction of visual stimuli in the experiments
A, a set of visual stimuli with centre–surround discontinuity defined by the luminance cue. Each stimulus pattern consisted of two grating patches, a centre grating (x-axis) and a surround annular grating (y-axis). The centre of the patches was set at the centre of the CRF. In each experiment, the set of centre–surround combinations were presented in a pseudo-random sequence. B, six visual cues used to introduce centre–surround discontinuity: luminance (from 100 to 102 cd m−2, step 100.2 cd m−2 in logarithmic scale), contrast (from 10 to 90%, step 10%), colour (red, yellow, green, cyan, blue, purple), orientation (from 0 to 330 deg, step 30 deg), spatial frequency (from 0.2 to 3.2 cycles deg−1, step 0.3 cycles deg−1) and moving velocity (from 1.5 to 6 deg s−1, step 0.5 deg s−1). Note that, when one feature was used to introduce the discontinuity, the other features were held at the optimal value of the cell in both the centre and surround patches.
Figure 9
Figure 9. Surface–contour plots showing the responses of V1 cells to the centre–surround discontinuity defined by random dots
A and B, response of a single V1 cell as a function of centre–surround discontinuity in moving direction (A, from 0 deg to 330 deg, step 30 deg) and velocity (B, from 100 to 101 deg s−1, step 100.2 deg s−1). The difference in response between the diagonal regions and off-diagonal regions is statistically significant in both A and B (P < 0.001, Mann–Whitney U test). C and D, same as A and B, respectively, except that the results were averaged from 16 cells with strong surround suppression (suppression index > 0.5). The difference in response between the diagonal and off-diagonal regions is statistically significant in both C and D (P < 0.001, Mann–Whitney U test).
Figure 2
Figure 2. Surface–contour plots showing the responses of an individual V1 cell to stimuli with centre–surround discontinuities defined by six visual features: luminance, contrast, colour, orientation, spatial frequency and moving velocity
Shown in each plot A–F are the responses after subtracting the spontaneous firing rate. Magnitude of the response for each combination is shown by the height (z-axis) of the surface and colour of the contour. Colour scale bar shows response magnitude. The difference in response between the diagonal and off-diagonal regions was statistically significant in all six cases (P < 0.001, Mann–Whitney U test). The response of this cell to optimal stimulus in the CRF alone was shown by the grey plane near the top (drifting grating at preferred orientation and spatiotemporal frequency).
Figure 6
Figure 6. Relationship between the discontinuity sensitivity and the strength of surround suppression
Each point represents data from one cell. A–F, discontinuities defined by six visual features: luminance (n = 77), contrast (n = 93), colour (n = 66), orientation (n = 93), spatial frequency (n = 83) and moving velocity (n = 91). Single unit data are represented by □ (complex cells) and ▵ (simple cells). Multi-unit data are represented by filled dots (complex cells) and crosses (simple cells). The straight lines show linear regression of the data points. Significant correlation was found in all six cases (P < 0.01). The correlation coefficients were: CClum = 0.80; CCcon = 0.72; CCcol = 0.66; CCori = 0.70; CCspf = 0.80; CCvel = 0.84.
Figure 3
Figure 3. The average responses of 20 V1 neurons with strong surround suppression to stimuli with centre–surround discontinuities defined by six visual features
The format is identical to that in Fig. 2. After subtracting the spontaneous firing rate, the responses of each cell were normalized by the response to optimal stimulus in the CRF alone before being averaged across cells. For D, the different cells were aligned by their optimal orientation before averaging. The difference in response between the diagonal and off-diagonal regions was statistically significant in all cases (P < 0.001, Mann–Whitney U test).
Figure 4
Figure 4. Discontinuity sensitivity index (DSI) of the 20 V1 cells with strong surround suppression (Fig. 3)
The DSIs (lum, luminance; con, contrast; col, colour; ori, orientation; spf, special frequency; vel, velocity) are normalized by the highest DSI of each cell. Each line represents data from one cell.
Figure 5
Figure 5. Orientation tuning and centre–surround discontinuity sensitivity
A, surface–contour plots showing the responses of a V1 cell with weak orientation tuning within the CRF (the same cell as shown in Fig. 2, preferred orientation: 280 deg). The format is identical to that in Fig. 2. The difference in response between the diagonal and off-diagonal regions is statistically significant (P < 0.001, Mann–Whitney U test). B, tuning of the cell (A) to centre orientation when surround orientation was fixed at 0 deg (blue line) and when surround orientation is the same as the centre (red line). Dashed line shows spontaneous responses. The black line in the top shows cell responses to preferred centre stimulus alone. C and D, similar to A and B, but for a cell sharply tuned to orientation (preferred orientation in CRF: 75 deg).
Figure 8
Figure 8. Distributions of eye position for stimulus trials with and without centre–surround discontinuity
A, B and C, the distributions of eye positions in trials without (A) and with (B) discontinuity, obtained while recording from a cell showing high sensitivity to discontinuity (C). The fixation window was 0.9 deg. The upper and right panels are the histograms of the x and y eye positions, respectively. The standard deviations of the eye position distributions were 0.131 deg (A) and 0.133 deg (B) for horizontal direction and 0.153 deg (A) and 0.152 deg (B) for vertical direction. D and E, comparison of standard deviation of eye position distributions in trials with and without centre–surround discontinuity. F, comparison of frequency of microsaccades.

References

    1. Akasaki T, Sato H, Yoshimura Y, Ozeki H, Shimegi S. Suppressive effects of receptive field surround on neuronal activity in the cat primary visual cortex. Neurosci Res. 2002;43:207–220. - PubMed
    1. Albright TD. Form-cue invariant motion processing in primate visual cortex. Science. 1992;255:1141–1143. - PubMed
    1. Allman J, Miezin F, McGuinness E. Stimulus specific responses from beyond the classical receptive field: neurophysiological mechanisms for local-global comparisons in visual neurons. Annu Rev Neurosci. 1985;8:407–430. - PubMed
    1. Anderson JS, Lampl I, Gillespie DC, Ferster D. Membrane potential and conductance changes underlying length tuning of cells in cat primary visual cortex. J Neurosci. 2001;21:2104–2112. - PMC - PubMed
    1. Blakemore C, Tobin EA. Lateral inhibition between orientation detectors in the cat's visual cortex. Exp Brain Res. 1972;15:439–440. - PubMed

Publication types

LinkOut - more resources