. 2007 Oct 1;110(7):2727-35.
doi: 10.1182/blood-2007-04-084921. Epub 2007 Jun 28.

A network model to predict the risk of death in sickle cell disease

Affiliations

A network model to predict the risk of death in sickle cell disease

Paola Sebastiani et al. Blood. .

Abstract

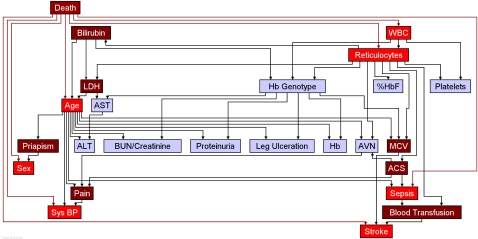
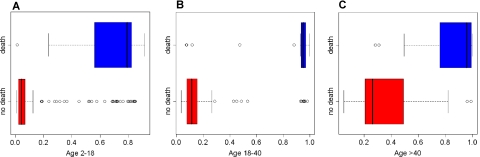
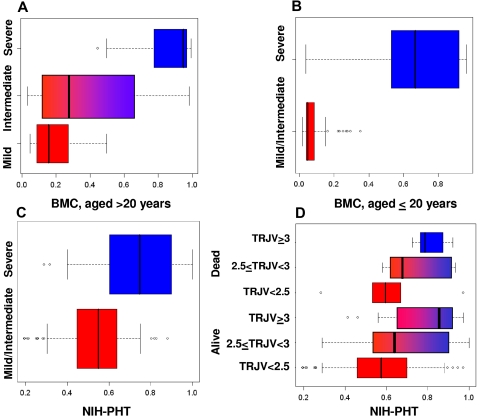
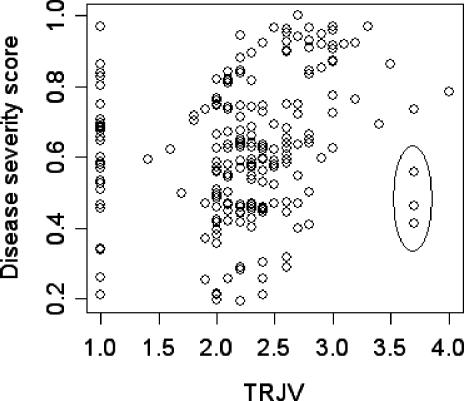
Modeling the complexity of sickle cell disease pathophysiology and severity is difficult. Using data from 3380 patients accounting for all common genotypes of sickle cell disease, Bayesian network modeling of 25 clinical events and laboratory tests was used to estimate sickle cell disease severity, which was represented as a score predicting the risk of death within 5 years. The reliability of the model was supported by analysis of 2 independent patient groups. In 1 group, the severity score was related to disease severity based on the opinion of expert clinicians. In the other group, the severity score was related to the presence and severity of pulmonary hypertension and the risk of death. Along with previously known risk factors for mortality, like renal insufficiency and leukocytosis, the network identified laboratory markers of the severity of hemolytic anemia and its associated clinical events as contributing risk factors. This model can be used to compute a personalized disease severity score allowing therapeutic decisions to be made according to the prognosis. The severity score could serve as an estimate of overall disease severity in genotype-phenotype association studies, and the model provides an additional method to study the complex pathophysiology of sickle cell disease.


Figures

Figure 1
Figure 1
The network of associations between death, clinical complications, and laboratory findings in sickle cell disease. The arc (arrow) direction specifies the conditional probability tables that are sufficient to compute the overall distribution. Colored in red are the nodes that alone are sufficient to predict the risk for death (severity score). Nodes in blue are associated with predictive nodes in red. For example, the Hb genotype is associated with several laboratory variables including WBC and LDH and thus modulates disease severity indirectly through these nodes. See Tables 3,4. ACS indicates acute chest syndrome; AVN, avascular necrosis; BUN/creatinine, ratio of BUN to creatinine; Sys BP, systolic blood pressure; Hb, total hemoglobin concentration; %HbF, percentage of fetal hemoglobin; WBC, leukocyte count; Hb genotype, sickle cell anemia, sickle cell anemia-α thalassemia, HbSC disease.
Figure 2
Figure 2
Distribution of disease severity score in 1 validation test set. Each box plot displays the observations between the first and the third quartile in the rectangle, with a line for the median. The whiskers extend to 1.5 times the interquartile range from each end of the rectangle. Circles represent outliers beyond the end of the whiskers. Box plots in blue display the score distribution for patients who died, and box plots in red display the score distribution for survivors. There is a separation between the scores of subjects in these groups that is especially clear in patients aged 18 to 40 years (B). In the group aged 2 to 18 years (A), 2 subjects with a score below 0.5 died. Both subjects (1 HbSC, score 0.01; 1 with sickle cell anemia, score 0.24) died for unknown causes. In the group aged 18 to 40 years (B), 2 of the 4 subjects with low severity score died for unknown causes as did 2 of the 3 subjects with low severity score in the group aged older than 40 years (C). Many young subjects with a high severity score survived until the end of the follow-up, consistent with the high survival rate of children even with a severe clinical profile.
Figure 3
Figure 3
Validations in independent patient groups. (A,B) Validation in patients from the Boston Medical Center. (A) Distribution of severity score (x-axis) for groups of adults (aged ≥ 18 years) whose clinical status was assessed as mild, intermediate, or severe. (B) Distribution of severity score (x-axis) for the pediatric groups (aged < 18 years) whose clinical status was assessed as mild/intermediate (bottom) and severe. (C,D) Validation in patients from the NIH. (C) Distribution of severity score (x-axis) for patients whose clinical status was determined as mild/intermediate (bottom box plot) and severe (top box plot). (D) Distribution of severity score of the 19 subjects who died during the follow-up (top 3 box plots) and the 191 subjects who survived the follow-up (bottom 3 box plots), grouped as follows: no pulmonary hypertension (tricuspid regurgitant jet velocity ≤ 2.5 m/s); mild pulmonary hypertension (2.5 < tricuspid regurgitant jet velocity < 3 m/s); severe pulmonary hypertension (tricuspid regurgitant jet velocity ≥ 3.0 m/s).
Figure 4
Figure 4
Scatter plot of the disease severity score (y-axis) versus the tricuspid regurgitant jet velocity (m/s; x-axis) in the 210 subjects of the NIH–Pulmonary Hypertension Screening Study. For 29 subjects, the tricuspid regurgitant jet velocity could not be measured and was set equal to 1. The score of these 29 subjects ranges from 0.2 to 0.97; more than 75% of these subjects have a score above 0.5 and would be judged as severe. The 3 points highlighted by an ellipse represent a discordance in assessing the severity between our score and the tricuspid regurgitant jet velocity. While these patients have a tricuspid regurgitant jet velocity greater than 3 m/s (high risk of death), our model assigns them scores of 0.41, 0.46 (not at risk), and 0.60 (mild risk). One subject (score 0.41) had mitral valve insufficiency, subsequently treated surgically, so that the high tricuspid regurgitant jet velocity was due to cardiac disease. The second subject (score 0.46) had very severe pulmonary hypertension associated with very severe obstructive sleep apnea requiring tracheostomy. The third subject (score 0.6) had undergone apparently successful nonmyeloablative bone marrow transplantation since enrollment. She appeared to have typical sickle cell disease–associated pulmonary hypertension but was on chronic transfusion at the time of enrollment.

Comment in

References

    1. Frempong KO, Steinberg MH. Clinical aspects of sickle cell anemia in adults and children. In: Steinberg MH, Forget BG, Higgs DR, Nagel RL, editors. Disorders of Hemoglobin: Genetics, Pathophysiology, and Clinical Management. 1st ed. Cambridge, England: Cambridge University Press; 2001. pp. 611–670.
    1. Stuart MJ, Nagel RL. Sickle-cell disease. Lancet. 2004;364:1343–1360. - PubMed
    1. Platt OS, Brambilla DJ, Rosse WF, et al. Mortality in sickle cell disease: life expectancy and risk factors for early death. N Engl J Med. 1994;330:1639–1644. - PubMed
    1. Steinberg MH, Dreiling BJ, Morrison FS, Necheles TF. Mild sickle cell disease: clinical and laboratory studies. JAMA. 1973;224:317–321. - PubMed
    1. Odenheimer DJ, Sarnaik SA, Whitten CF, Rucknagel DL, Sing CF. The relationship between fetal hemoglobin and disease severity in children with sickle cell anemia. Am J Med Genet. 1987;27:525–535. - PubMed

Publication types