

Review
doi: 10.1126/science.1143986.
Genome plasticity a key factor in the success of polyploid wheat under domestication
Affiliations
- PMID: 17600208
- PMCID: PMC4737438
- DOI: 10.1126/science.1143986
Item in Clipboard
Review
Genome plasticity a key factor in the success of polyploid wheat under domestication
Science.
.
Erratum in
- Science. 2007 Oct 19;318(5849):393
Abstract
Wheat was domesticated about 10,000 years ago and has since spread worldwide to become one of the major crops. Its adaptability to diverse environments and end uses is surprising given the diversity bottlenecks expected from recent domestication and polyploid speciation events. Wheat compensates for these bottlenecks by capturing part of the genetic diversity of its progenitors and by generating new diversity at a relatively fast pace. Frequent gene deletions and disruptions generated by a fast replacement rate of repetitive sequences are buffered by the polyploid nature of wheat, resulting in subtle dosage effects on which selection can operate.
Figures
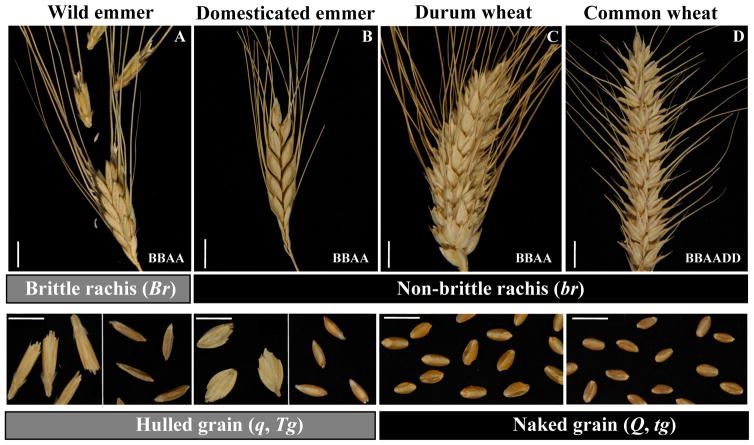
Wheat spikes showing A) brittle rachis, B–D) non-brittle rachis, A–B) hulled grain, C–D) naked grain. A) wild emmer wheat (T. turgidum ssp. dicoccoides), B) domesticated emmer (T. turgidum ssp. dicoccon), C) durum (T. turgidum ssp. durum), and D) common wheat (T. aestivum). White bars represent 1 cm. Letters at the lower right corner indicate the genome formula of each type of wheat. Gene symbols: Br = brittle rachis, Tg = tenacious glumes, and Q = square head. Photos by C. Uauy.
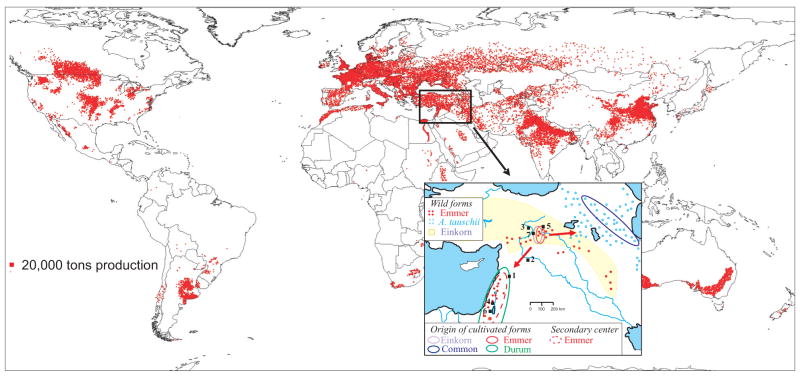
The origin and current distribution of wheat. The wheat production map was provided by Dave Hodson, CIMMYT (20). The solid line ovals in the inset indicate the geographic regions of origin of the cultivated forms, while the dotted red line indicates a southern center of emmer diversity. The approximate distributions of wild emmer and Ae. tauschii are indicated by dots and that of wild einkorn by yellow shading (3). Numbers indicate archeological sites where remains of domesticated cereals dating back more than 9000 years BP were found: 1) Tell Aswad, 2) Abu Hureyra, 3) Cafer Höyük, 4) Jericho, 5) Cayönü, 6) Nahal Hemar, 7) Nevali Cori (from (2)).
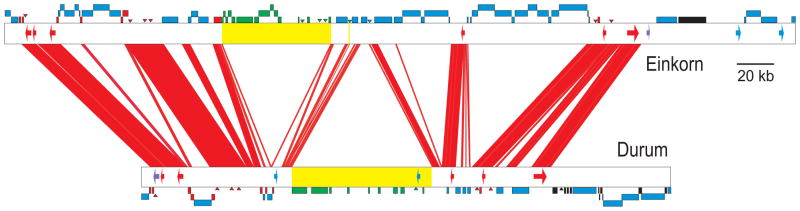
DNA insertions and deletions in orthologous VRN2 regions from the Am genome of T. monococcum (AY485644) and the A genome of durum wheat variety Langdon (new sequence EF540321), which diverged 1.1 ± 0.1 MYA. The red lines connect orthologous regions (>96% identical). Arrows represent genes: red = orthologous, blue = ortholog absent, violet = pseudogene. Rectangles represent repetitive elements in their actual nested structure: red = orthologous, blue = insertions after divergence, green = deletion in the opposite genome (yellow region), black = not determined. Only 31% of the orthologous intergenic regions have not been replaced. See supporting online text for details.
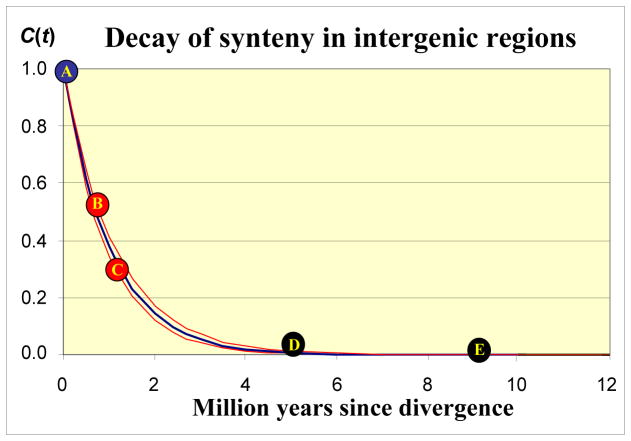
Decay of the proportion of conserved sequences (C(t)) in orthologous intergenic regions with divergence time. The upper and lower red curves were calculated using two independent decay rate constants (K1 and K2), and the blue curve using an average rate constant. A) The blue circle represents identical sequences at the initial time of divergence. B) The comparison between T. urartu and durum A genome PSR920 regions was used to estimate K1 (upper red curve) (29). C) The comparison between einkorn and durum A genome VRN2 regions was used to estimate K2 (lower red curve). D) Comparison of orthologous intergenic regions between wheat B genome (AY368673) and D genome (AF497474) GLU1 regions (58). E) Comparison of orthologous intergenic regions between wheat (AF459639) and barley (AY013246) VRN1 regions (40, 41). See supporting online text for details.
References
-
- FAO. Statistical Yearbook 2005–2006. United Nations: 2006. WEB Edition.
-
- Nesbitt M, Samuel D. In: Padulosi S, Hammer K, Heller J, editors. From staple crop to extinction? The archaeology and history of hulled wheats; Proc. 1st Int. Workshop on hulled wheats; Castelvecchio, Pacoli, Italy. Rome, Italy: Int. Plant Genet. Res. Inst; 1996.
-
- Zohary D, Hopf M. Domestication of plants in the Old World. 3. Oxford University Press; Oxford, Oxford: 2000.
-
- Wendel JF. Plant Mol Biol. 2000;42:225. - PubMed
-
- Stebbins GL. Variation and Evolution in Plants. Columbia University Press; New York: 1950.
Publication types
MeSH terms
Substances
Grants and funding
LinkOut - more resources
Full Text Sources
