. 2007 Sep 15;176(6):591-601.
doi: 10.1164/rccm.200611-1743OC. Epub 2007 Jun 28.

Fas-induced pulmonary apoptosis and inflammation during indirect acute lung injury

Affiliations

Fas-induced pulmonary apoptosis and inflammation during indirect acute lung injury

Mario Perl et al. Am J Respir Crit Care Med. .

Abstract

Rationale: Indirect acute lung injury (ALI) is associated with high morbidity and mortality. No specific therapies have been developed, because the underlying pathophysiological processes remain elusive.

Objectives: To investigate the contribution of Fas-induced apoptotic and nonapoptotic/inflammatory signaling to the pathology of indirect ALI.

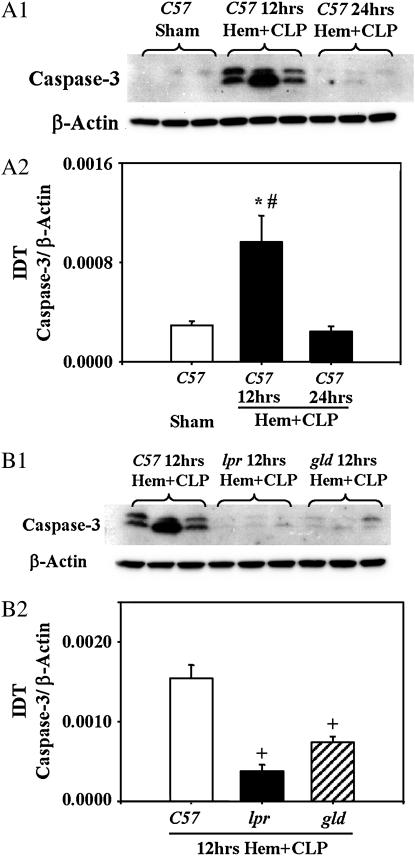
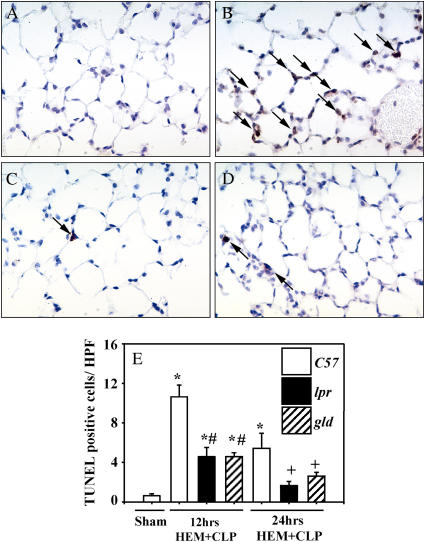
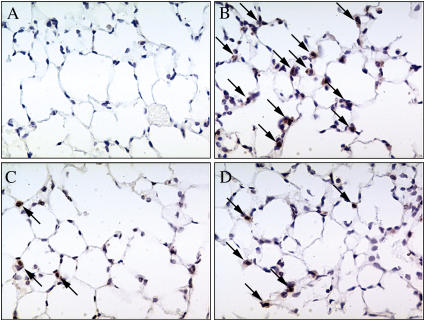
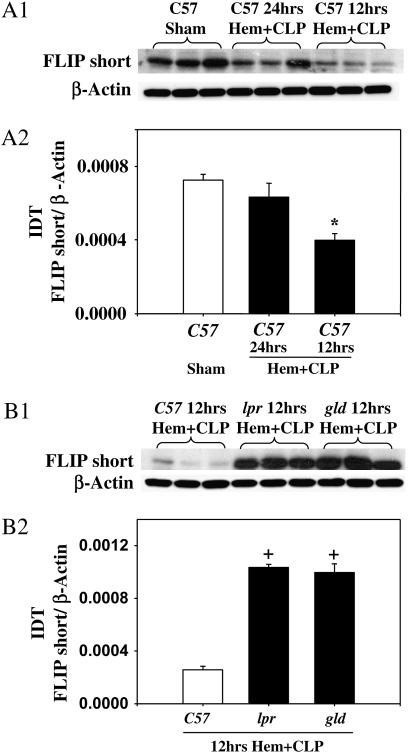
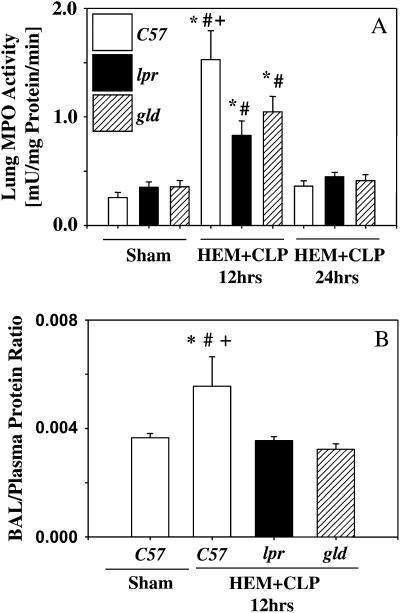
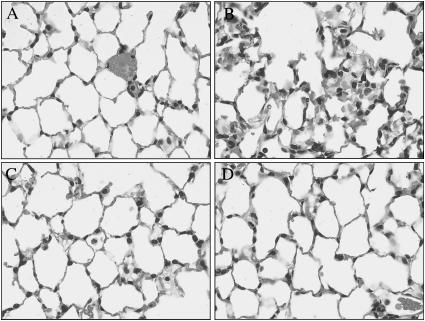
Methods: A mouse model of indirect ALI, induced by successive exposure to hemorrhagic shock and cecal ligation and puncture, was used. Quantification of active caspase-3 and the short splice variant of FLICE-inhibitory protein, (FLIP)short, was performed by Western blotting and immunohistochemistry, and cytokines/chemokines were assessed by cytometric bead array or ELISA. M30 immunostaining was done to evaluate epithelial cell apoptosis. Lung injury was assessed on the basis of myeloperoxidase activity, bronchoalveolar lavage protein, and lung histology.

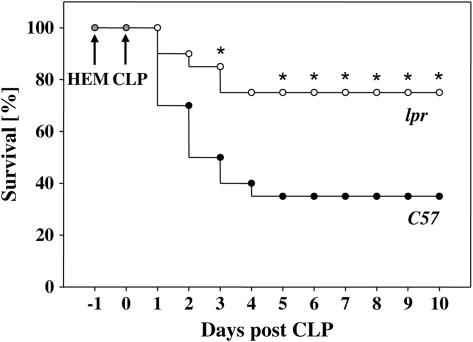
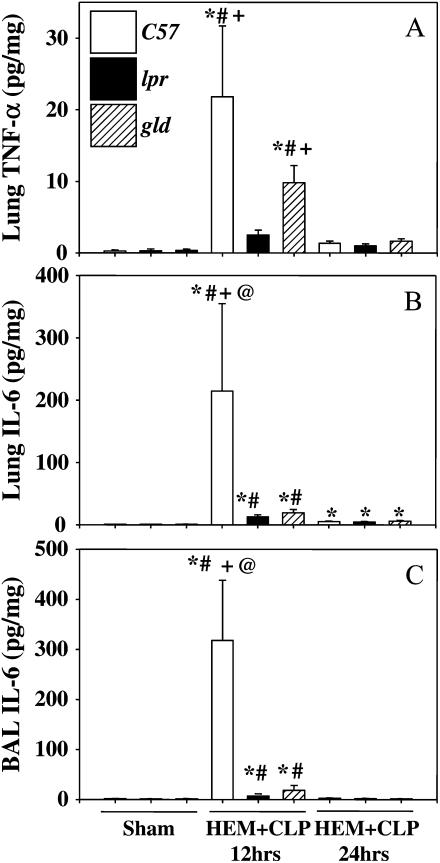
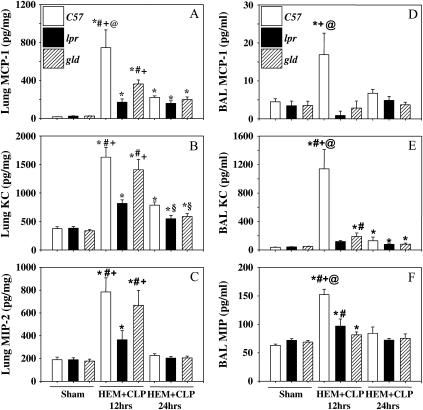
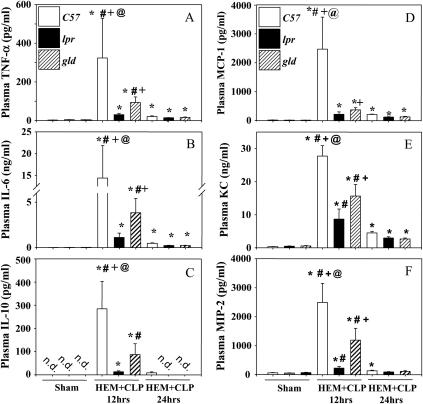
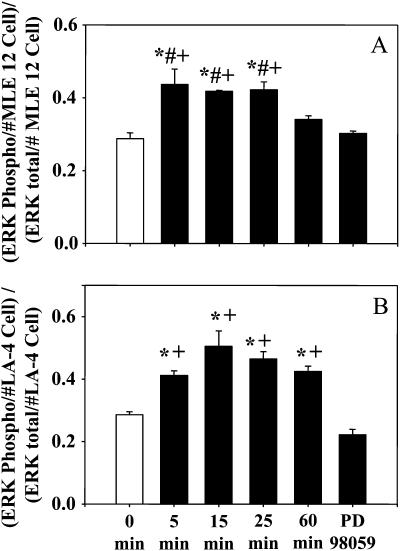
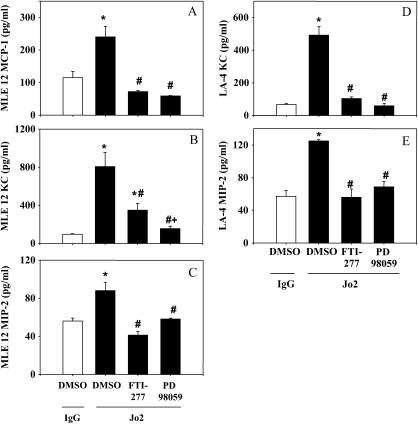
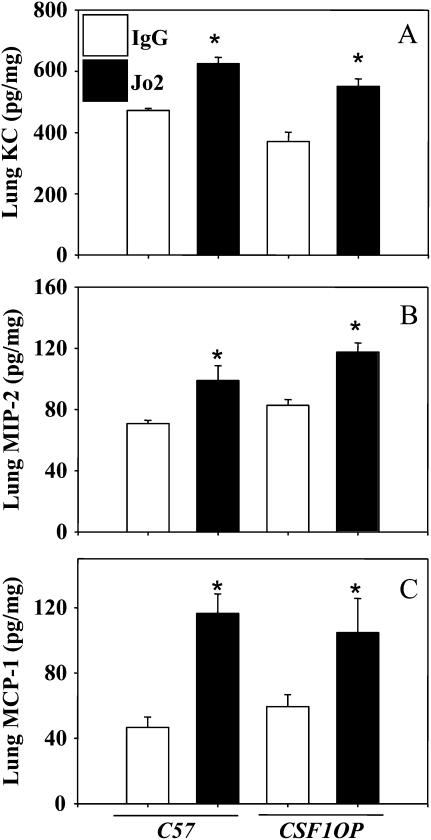
Measurements and main results: Twelve hours after insult, lung monocyte chemoattractant protein-1, keratinocyte-derived chemokine, macrophage inflammatory protein-2, IL-6, tumor necrosis factor-alpha, and caspase-3 were increased and FLIP(short) was decreased. Fas- and Fas ligand-deficient mice showed marked protection from lung inflammation and apoptosis and decreased ALI. This was associated with a 10-day survival benefit. Similarly, 4 hours after pulmonary instillation of Fas-activating antibody in vivo, lung chemokines were markedly elevated in background mice and, interestingly, to a similar degree in macrophage-deficient animals. Fas activation on lung epithelial cells in vitro led to chemokine production that was dependent on extracellular signal-regulated kinase.

Conclusions: Activation of apoptotic and nonapoptotic/inflammatory Fas signaling is an early important pathophysiological event in the development of indirect ALI after hemorrhagic shock and sepsis, in which lung epithelial cells appear to play a central role.


Figures

<b>Figure 1.</b>
Figure 1.
(A1) Pulmonary caspase-3 in sham-treated background (C57) mice and C57 mice 12 and 24 hours after hemorrhagic shock and sepsis (HEM+CLP). (A2) Integrated density (IDT) values of active caspase-3 relative to IDT values of β-actin of n = 6 animals per group. Quantification was done by Western blotting and densitometry. Statistical analysis involved one-way analysis of variance (ANOVA) followed by the Student-Newman-Keuls test. *p < 0.05 versus corresponding sham group, #P < 0.05 versus corresponding 24 hours HEM+CLP. (B1) Pulmonary caspase-3 in background (C57) mice, Fas-deficient (lpr) mice, and Fas ligand (gld) mice 12 hours after HEM+CLP (B1). (B2) IDT values of active caspase-3 relative to IDT values of β-actin of n = 6 animals per group. Quantification was done by Western blotting and densitometry. Statistical analysis involved one-way ANOVA followed by the Student-Newman-Keuls test. +P < 0.05 versus C57 HEM+CLP.
<b>Figure 2.</b>
Figure 2.
(AD) Representative active caspase-3 immunohistochemistry of lung tissue samples from (A) a sham-treated animal and from (B) background (C57), (C) Fas-deficient (lpr), and (D) Fas ligand–deficient (gld) animals 12 hours after hemorrhagic shock and sepsis (HEM+CLP). Arrows indicate active caspase-3–positive cells. Original magnification, ×400. (E) Terminal deoxynucleotidyltransferase biotin-dUTP nick end labeling (TUNEL)–positive cells per high-power field (HPF) 12 and 24 hours after insult in the same experimental groups. * P< 0.05 versus sham group, #P < 0.05 versus C57 24 hours after HEM+CLP, +P < 0.05 versus C57 24 hours after HEM+CLP.
<b>Figure 3.</b>
Figure 3.
Representative M30 immunohistochemistry of lung tissue samples from (A) sham-treated, (B) background (C57), (C) Fas-deficient (lpr), and (D) Fas ligand–deficient (gld) mice 12 hours after hemorrhagic shock and sepsis. Arrows indicate M30-positive cells. Original magnification, ×400.
<b>Figure 4.</b>
Figure 4.
(A1) Pulmonary FLIPshort (the short splice variant of FLICE-inhibitory protein) in sham background (C57) mice, and in C57 mice 12 and 24 hours after hemorrhagic shock and sepsis (HEM+CLP). (A2) Integrated density (IDT) values of FLIPshort relative to IDT values of β-actin of n = 5 animals per group. Quantification was done by Western blotting and densitometry. Statistical analysis involved one-way ANOVA followed by the Student-Newman-Keuls test. *P < 0.05 versus corresponding sham group. (B1) Pulmonary FLIPshort in C57, Fas-deficient (lpr), and Fas ligand–deficient (gld) mice 12 hours after HEM+CLP. (B2) IDT values of active caspase-3 relative to IDT values of β-actin of n = 6 animals per group. Quantification was done by Western blotting and densitometry. Statistical analysis involved one-way ANOVA followed by the Student-Newman-Keuls test. +P < 0.05 versus C57 HEM+CLP.
<b>Figure 5.</b>
Figure 5.
(A) Lung myeloperoxidase (MPO) activity concentrations in Fas-deficient (lpr), Fas ligand–deficient (gld), and wild-type (C57) mice 12 and 24 hours after hemorrhagic shock and sepsis (HEM+CLP). n = 8 per group. Statistical analysis involved two-way ANOVA followed by the Student-Newman-Keuls test. *P < 0.05 versus corresponding sham group, #P < 0.05 versus corresponding group 24 hours after HEM+CLP, +P < 0.05 versus lpr 12 hours after HEM+CLP. (B) Quantification of total bronchoalveolar lavage (BAL) protein in Fas-deficient (lpr), Fas ligand–deficient (gld), and wild-type (C57) mice 12 hours after HEM+CLP. n = 6 per group. Statistical analysis involved one-way ANOVA followed by the Student-Newman-Keuls test. *P < 0.05 versus sham group, #P < 0.05 versus lpr, +P < 0.05 versus gld.
<b>Figure 6.</b>
Figure 6.
(AD) Representative hematoxylin and eosin–stained preparations of lung tissue from animals 12 hours after hemorrhagic shock and sepsis (HEM+CLP). (A) Sham animals display regular lung histology. (B) Twelve hours after HEM+CLP background animals displayed typical signs of congestion, disruption of alveolar architecture, and increased numbers of neutrophils within the alveolar walls. (C) Fas-deficient (lpr) and (D) Fas ligand (FasL)–deficient (gld) animals were largely protected from these alterations. Original magnification, ×400.
<b>Figure 7.</b>
Figure 7.
Ten-day survival in Fas-deficient (lpr) and background (C57) animals after hemorrhagic shock (HEM) and subsequent cecal ligation and puncture (CLP) 24 hours thereafter. *P < 0.05 versus C57 (Fisher's exact test of n = 20 animals per group).
<b>Figure 8.</b>
Figure 8.
(A) Lung tumor necrosis factor (TNF)-α, (B) lung IL-6, and (C) bronchoalveolar lavage (BAL) IL-6 concentrations in Fas-deficient (lpr), Fas ligand–deficient (gld), and wild-type (C57) mice 12 and 24 hours after hemorrhagic shock and sepsis (HEM+CLP). Quantification was done by ELISA or cytometric bead assay (CBA). n = 8 per group for lung and n = 6 per group for BAL. Statistical analysis involved two-way ANOVA followed by the Student-Newman-Keuls test. *P < 0.05 versus corresponding sham group, #P < 0.05 versus corresponding group 24 hours after HEM+CLP, +P < 0.05 versus lpr 12 hours after HEM+CLP, @P < 0.05 versus gld 12 hours after HEM+CLP.
<b>Figure 9.</b>
Figure 9.
Lung and bronchoalveolar lavage (BAL) fluid macrophage chemoattractant protein (MCP)-1 (A and D), keratinocyte-derived chemokine (KC) (B and E), and macrophage inflammatory protein (MIP)-2 (C and F) concentrations in Fas-deficient (lpr), Fas ligand–deficient (gld), and wild-type (C57) mice 12 and 24 hours after hemorrhagic shock and sepsis (HEM+CLP). Quantification was done via ELISA or cytometric bead assay. n = 8 per group for lung and n = 6 per group for BAL. Statistical analysis involved two-way ANOVA followed by the Student-Newman-Keuls test. *P < 0.05 versus corresponding sham group, #P < 0.05 versus corresponding group 24 hours after HEM+CLP, +P < 0.05 versus lpr 12 hours after HEM+CLP, @P < 0.05 versus gld 12 hours after HEM+CLP, §P < 0.05 versus C57 24 hours after HEM+CLP.
<b>Figure 10.</b>
Figure 10.
Plasma tumor necrosis factor (TNF)-α (A), IL-6 (B), IL-10 (C), macrophage chemoattractant protein (MCP)-1 (D), keratinocyte-derived chemokine (KC) (E), and macrophage inflammatory protein (MIP)-2 (F) in Fas-deficient (lpr), Fas ligand–deficient (gld), and wild-type mice (C57) 12 and 24 hours after hemorrhagic shock and sepsis (HEM+CLP). Quantification was done by ELISA or cytometric bead assay. n = 8 per group. Statistical analysis involved two-way ANOVA followed by the Student-Newman-Keuls test. *P < 0.05 versus corresponding sham group, #P < 0.05 versus corresponding group 24 hours after HEM+CLP, +P < 0.05 versus lpr 12 hours after HEM+CLP, @P < 0.05 versus gld 12 hours after HEM+CLP.
<b>Figure 11.</b>
Figure 11.
Time course of Fas-induced activation of extracellular signal–regulated kinase (ERK)1/2 (as illustrated by the increase in the ratio of phosphorylated to total ERK) in (A) MLE 12 cells and (B) LA-4 cells after exposure to Jo2 antibody (50 ng/ml). n = 4 per group. Statistical analysis involved one-way ANOVA followed by the Student-Newman-Keuls test. * P< 0.05 versus 0 minutes, #P < 0.05 versus 60 minutes, +P < 0.05 versus PD 98059.
<b>Figure 12.</b>
Figure 12.
Chemokine production by MLE 12 cells (AC) and LA-4 cells (D and E) 4 hours after activation of Fas (Jo2 monoclonal antibody at 50 ng/ml). n = 4 per group. Statistical analysis involved one-way ANOVA followed by the Student-Newman-Keuls test. *P < 0.05 versus DMSO/IgG, #P < 0.05 versus DMSO/Jo2, +P < 0.05 versus FTI-277/Jo2.
<b>Figure 13.</b>
Figure 13.
(AC) Chemokine production in lungs of background (C57) and macrophage-deficient animals (CFS1OP) 4 hours after instillation of Fas-activating antibody Jo2. n = 4 or 5 per group. Statistical analysis involved one-way ANOVA followed by the Student-Newman-Keuls test. * P< 0.05 versus corresponding IgG.

References

    1. Frutos-Vivar F, Nin N, Esteban A. Epidemiology of acute lung injury and acute respiratory distress syndrome. Curr Opin Crit Care 2004;10:1–6. - PubMed
    1. MacCallum NS, Evans TW. Epidemiology of acute lung injury. Curr Opin Crit Care 2005;11:43–49. - PubMed
    1. Brun-Buisson C, Minelli C, Bertolini G, Brazzi L, Pimentel J, Lewandowski K, Bion J, Romand JA, Villar J, Thorsteinsson A, et al. Epidemiology and outcome of acute lung injury in European intensive care units: results from the ALIVE Study. Intensive Care Med 2004;30:51–61. - PubMed
    1. Bersten AD, Edibam C, Hunt T, Moran J. Incidence and mortality of acute lung injury and the acute respiratory distress syndrome in three Australian states. Am J Respir Crit Care Med 2002;165:443–448. - PubMed
    1. Takeda S, Ishizaka A, Fujino Y, Fukuoka T, Nagano O, Yamada Y, Takezawa J. Time to change diagnostic criteria of ARDS: towards the disease entity-based subgrouping. Pulm Pharmacol Ther 2005;18:115–119. - PubMed

Publication types

MeSH terms