

Role of neuronal activity and kinesin on tract tracing by manganese-enhanced MRI (MEMRI)
- PMID: 17600729
- PMCID: PMC2096707
- DOI: 10.1016/j.neuroimage.2007.04.053
Role of neuronal activity and kinesin on tract tracing by manganese-enhanced MRI (MEMRI)
Abstract
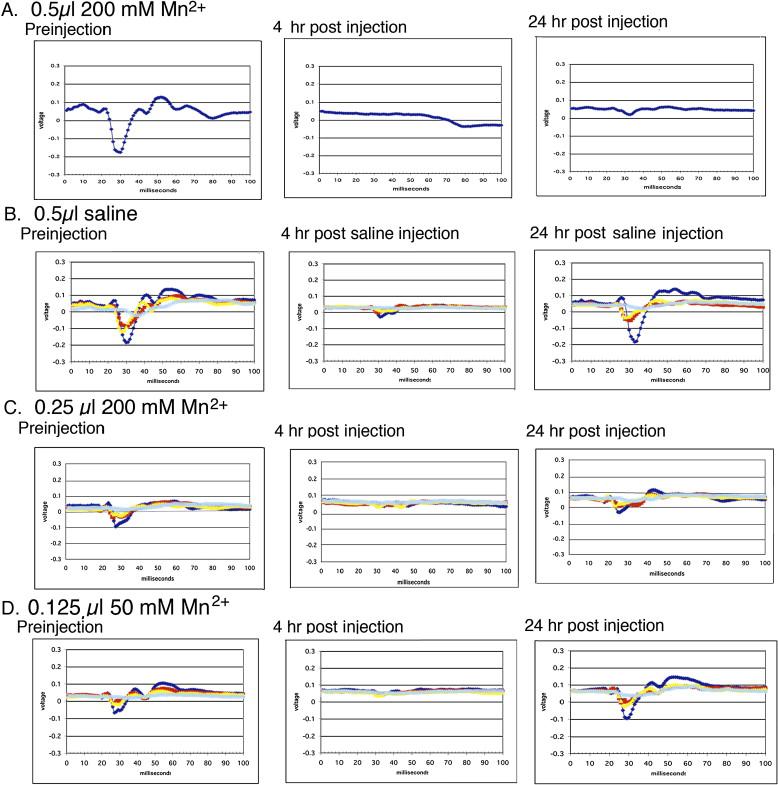
MEMRI offers the exciting possibility of tracing neuronal circuits in living animals by MRI. Here we use the power of mouse genetics and the simplicity of the visual system to test rigorously the parameters affecting Mn2+ uptake, transport and trans-synaptic tracing. By measuring electrical response to light before and after injection of Mn2+ into the eye, we determine the dose of Mn2+ with the least toxicity that can still be imaged by MR at 11.7 T. Using mice with genetic retinal blindness, we discover that electrical activity is not necessary for uptake and transport of Mn2+ in the optic nerve but is required for trans-synaptic transmission of this tracer to distal neurons in this pathway. Finally, using a kinesin light chain 1 knockout mouse, we find that conventional kinesin is a participant but not essential to neuronal transport of Mn2+ in the optic tract. This work provides a molecular and physiological framework for interpreting data acquired by MEMRI of circuitry in the brain.
Figures


Similar articles
-
In vivo imaging of optic nerve fiber integrity by contrast-enhanced MRI in mice.J Vis Exp. 2014 Jul 22;(89):51274. doi: 10.3791/51274. J Vis Exp. 2014. PMID: 25080017 Free PMC article.
-
Hippocampal to basal forebrain transport of Mn2+ is impaired by deletion of KLC1, a subunit of the conventional kinesin microtubule-based motor.Neuroimage. 2017 Jan 15;145(Pt A):44-57. doi: 10.1016/j.neuroimage.2016.09.035. Epub 2016 Oct 14. Neuroimage. 2017. PMID: 27751944 Free PMC article.
-
In vivo, trans-synaptic tract-tracing utilizing manganese-enhanced magnetic resonance imaging (MEMRI).NMR Biomed. 2004 Dec;17(8):595-601. doi: 10.1002/nbm.942. NMR Biomed. 2004. PMID: 15761948 Review.
-
Manganese-enhanced magnetic resonance imaging combined with electrophysiology in the evaluation of visual pathway in experimental rat models with monocular blindness.Brain Behav. 2017 May 22;7(7):e00731. doi: 10.1002/brb3.731. eCollection 2017 Jul. Brain Behav. 2017. PMID: 28729937 Free PMC article.
-
Applications of Manganese-Enhanced Magnetic Resonance Imaging in Ophthalmology and Visual Neuroscience.Front Neural Circuits. 2019 May 14;13:35. doi: 10.3389/fncir.2019.00035. eCollection 2019. Front Neural Circuits. 2019. PMID: 31156399 Free PMC article. Review.
Cited by
-
Preclinical Magnetic Resonance Imaging and Spectroscopy Studies of Memory, Aging, and Cognitive Decline.Front Aging Neurosci. 2016 Jun 29;8:158. doi: 10.3389/fnagi.2016.00158. eCollection 2016. Front Aging Neurosci. 2016. PMID: 27468264 Free PMC article. Review.
-
In vivo detection of excitotoxicity by manganese-enhanced MRI: comparison with physiological stimulation.Magn Reson Med. 2012 Jul;68(1):234-40. doi: 10.1002/mrm.23210. Epub 2011 Nov 29. Magn Reson Med. 2012. PMID: 22127903 Free PMC article. Clinical Trial.
-
Kinesin-1 transport reductions enhance human tau hyperphosphorylation, aggregation and neurodegeneration in animal models of tauopathies.Hum Mol Genet. 2010 Nov 15;19(22):4399-408. doi: 10.1093/hmg/ddq363. Epub 2010 Sep 3. Hum Mol Genet. 2010. PMID: 20817925 Free PMC article.
-
In vivo tracing of the ascending vagal projections to the brain with manganese enhanced magnetic resonance imaging.Front Neurosci. 2023 Sep 15;17:1254097. doi: 10.3389/fnins.2023.1254097. eCollection 2023. Front Neurosci. 2023. PMID: 37781260 Free PMC article.
-
Manganese-enhanced MRI of the DBA/2J mouse model of hereditary glaucoma.Invest Ophthalmol Vis Sci. 2008 Nov;49(11):5083-8. doi: 10.1167/iovs.08-2205. Epub 2008 Jun 14. Invest Ophthalmol Vis Sci. 2008. PMID: 18552381 Free PMC article.
References
-
- Bowes C, Li T, Danciger M, Baxter LC, Applebury ML, Farber DB. Retinal degeneration in the rd mouse is caused by a defect in the beta subunit of rod cGMP-phosphodiesterase. Nature. 1990;347:677–680. - PubMed
-
- Bowman AB, Kamal A, Ritchings BW, Philp AV, McGrail M, Gindhart JG, Goldstein LS. Kinesin-dependent axonal transport is mediated by the sunday driver (SYD) protein. Cell. 2000;103:583–594. - PubMed
-
- Brady ST, Lasek RJ, Allen RD. Fast axonal transport in extruded axoplasm from squid giant axon. Science. 1982;218:1129–1131. - PubMed
-
- Caley DW, Johnson C, Liebelt RA. The postnatal development of the retina in the normal and rodless CBA mouse: a light and electron microscopic study. Am J Anat. 1972;133:179–212. - PubMed
-
- Chevalier-Larsen E, Holzbaur EL. Axonal transport and neurodegenerative disease. Biochim Biophys Acta. 2006;1762:1094–1108. - PubMed
Publication types
MeSH terms
Substances
Grants and funding
LinkOut - more resources
Full Text Sources
Medical
